- Product
- Solution for
For Your Industry
- Plans & Pricing
- About us
- Resources
For Your Industry
In today’s hypercompetitive eCommerce landscape, assortment—not just price—decides who wins the digital shelf. While pricing strategies and marketing campaigns often take the spotlight, product assortment analysis quietly determines whether customers find what they’re looking for—or click away to a competitor.
Product assortment analysis goes beyond tracking SKUs. It’s about understanding which products drive traffic, sales, and profitability—and how your catalog aligns with shifting market demand.
For data-driven retailers, this is no longer optional. The right assortment strategy turns data into decisions, ensuring that each product earns its place on your digital shelf.
At its core, Product Assortment Analysis examines the composition, depth, and breadth of a retailer’s catalog. It looks at:
Breadth: The number of distinct product categories offered.
Depth: The number of SKUs or variations within a category.
Overlap: The similarity between your catalog and competitors’.
Gaps: Items or categories competitors carry that you don’t (and vice versa).
In competitive markets, assortment analysis extends beyond your internal view. It evaluates market-wide assortment data — identifying who’s offering what, how frequently assortments change, and where pricing or availability differ.
Your product mix determines:
Market coverage: Are you meeting customer demand across all relevant categories?
Differentiation: Are you offering something unique, or blending into the crowd?
Profitability: Are your assortments optimized for margin and volume balance?
Operational focus: Are you overstocked in slow movers or missing fast-moving SKUs?
Assortment decisions don’t happen in isolation. Every retailer’s catalog shapes — and is shaped by — competitors’ moves.
By comparing your assortment breadth to competitors, you can identify whether you’re positioned as a specialist (deep, narrow assortment) or a generalist (broad, shallow) — and whether that aligns with your brand and audience.
For instance:
If competitors have expanded into new subcategories (e.g., accessories, complementary items), it may signal rising consumer demand.
If they’re reducing depth, it may reflect overstock or declining sales in those segments.
Competitive assortment analysis reveals white spaces — areas where consumer demand exists but competition is thin. These are opportunities to introduce new SKUs, bundles, or private-label options.
Example:
A tech retailer notices that competitors list every major smartphone brand but lack accessories from emerging eco-friendly suppliers. Introducing sustainable phone cases becomes a differentiated entry point.
Without monitoring, retailers risk assortment drift — expanding too narrowly or neglecting trending products competitors are capturing early. Regular tracking ensures your catalog evolves in sync with the market.
Effective assortment analysis depends on reliable, up-to-date data. Here’s what’s typically analyzed:
| Data Type | Description | Use Case |
|---|---|---|
| Category hierarchy | Product taxonomy and structure | Identify gaps or redundancies |
| SKU-level data | Specific product availability and variants | Evaluate depth, coverage, overlap |
| Pricing data | Live and historical competitor prices | Link assortment to pricing strategy |
| Availability / stock status | In-stock vs out-of-stock trends | Detect lost sales opportunities |
| Brand representation | Brand share across competitors | Monitor brand dominance and gaps |
| New product introductions | Rate of SKU refresh | Spot innovation and agility trends |
In modern eCommerce, assortments change daily — even hourly. That’s why manual tracking no longer suffices. Automated data collection through competitive intelligence platforms (like tgndata’s) allows retailers to monitor changes in real time, ensuring every decision is informed by the latest market picture.
Let’s break down how to structure an effective analysis process.
Start by defining:
Which categories are strategically important.
Which competitors to benchmark (direct and indirect).
What level of granularity you need (brand, SKU, attribute level).
Collect structured product data including:
Product names, SKUs, brand, category hierarchy.
Stock status and pricing.
Launch or removal timestamps.
Platforms like tgndata automate this process using live web data, delivering structured insights without manual tracking.
Visualize category distribution. For example:
Category A: 150 SKUs (you) vs 210 (competitor X)
Category B: 60 SKUs (you) vs 45 (competitor Y)
Such analysis reveals underrepresented areas and overstocked ones.
Calculate SKU overlap ratios:
High overlap = strong competition, potential price wars.
Low overlap = differentiation, niche potential.
This informs both pricing and promotion strategy.
Link assortment structure to key performance metrics:
Conversion rates
Average order value (AOV)
Inventory turnover
Over time, you’ll identify patterns — e.g., wider assortment leads to higher traffic but lower AOV, or vice versa.
Product assortment isn’t static. Set up ongoing tracking to capture trends like:
New product introductions by competitors
Category expansions or contractions
Seasonal shifts
The best retailers use dynamic assortment analysis — updating strategies as fast as markets evolve.
Your assortment and pricing are two sides of the same strategy coin.
When you know which products competitors stock and how they price them, you can make smarter pricing moves:
Premium pricing opportunities: Offer exclusive SKUs that justify higher prices.
Gap-based promotions: Target categories competitors ignore with strong promotional visibility.
Price elasticity insight: Understand which assortment segments can absorb price shifts.
tgndata’s integrated pricing intelligence tools help retailers unify assortment visibility with pricing optimization — ensuring every SKU decision drives measurable revenue impact.
Scenario:
A mid-sized consumer electronics retailer struggles with declining margins and low turnover.
Action:
They perform a product assortment analysis comparing their catalog with five main competitors.
Findings:
22% of their SKUs were duplicated across all competitors.
18% of high-margin accessories competitors’ sold were missing from their own catalog.
Competitors introduced new products twice as fast, updating assortments weekly.
Outcome:
By introducing targeted new SKUs in underrepresented categories and removing redundant ones, they achieved:
+12% sales volume growth
+8% margin improvement
Reduced inventory holding costs by 10%
This illustrates how systematic assortment monitoring drives measurable commercial gains.
Even experienced teams fall into predictable traps:
Relying on static snapshots — Markets change daily; outdated data leads to missed trends.
Ignoring competitor dynamics — Your assortment only makes sense in context.
Focusing only on price — Product range and price interact; analyzing one without the other gives partial insight.
Overloading assortment — More isn’t always better; irrelevant SKUs dilute focus.
Neglecting data quality — Inaccurate product mapping can distort overlap or gap analysis.
Avoiding these pitfalls requires automation, consistency, and contextual understanding.
As AI and automation reshape retail analytics, assortment intelligence is moving toward:
Predictive assortment optimization — anticipating market shifts before they happen.
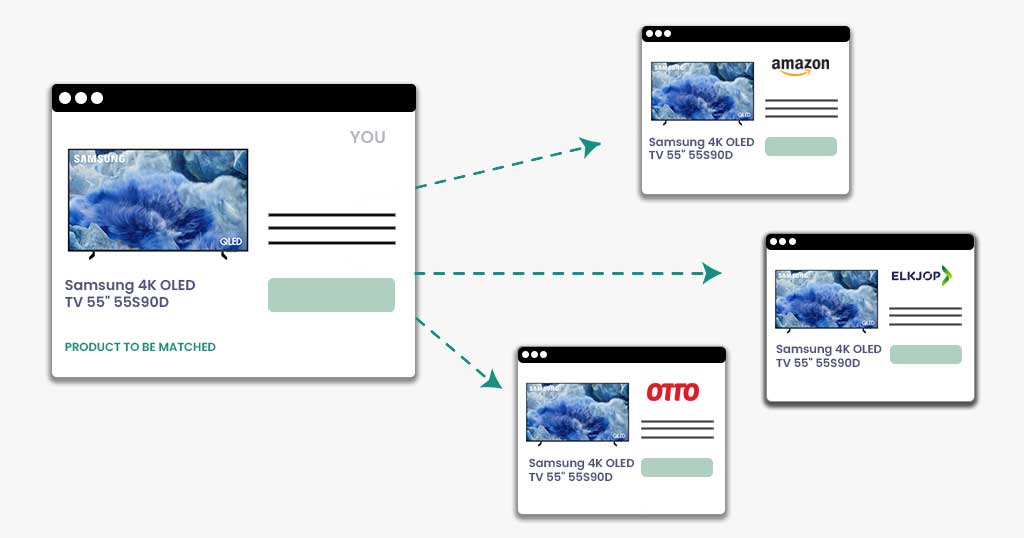
AI-driven product matching — accurately mapping similar products across thousands of competitors.
Dynamic catalog adaptation — continuously updating offerings based on live market signals.
Integration with pricing and promotion engines — aligning assortment, pricing, and stock strategies in real time.
With tools like tgndata, retailers can transform assortment from a reactive function to a proactive growth engine.
Product Assortment Analysis reveals where you stand in the market — your overlaps, gaps, and differentiation points.
Monitoring competitors’ assortments ensures your catalog evolves with demand and avoids blind spots.
Combining assortment and pricing data multiplies strategic precision.
Automation and live intelligence are now essential for real-time decision making.
Retailers that master assortment analysis don’t just follow the market — they lead it.
In eCommerce, assortment decisions are no longer set once a season — they’re made and remade continuously. Retailers who rely on static catalogs risk invisibility in a market that rewards agility.
Competition Product Assortment Analysis empowers teams to understand the market in full: where opportunities lie, what to prioritize, and how to position competitively.
With tgndata’s live assortment intelligence, you can benchmark your catalog, identify white spaces, and optimize every product decision to maximize growth.
Let’s talk. Discover how tgndata can help you build a smarter, data-driven assortment strategy.


We use cookies to provide you with an optimal experience, for marketing and statistical purposes only with your consent, which you may revoke at any time. Please refer to our Privacy Policy for more information.


Missing an important marketplace?
Send us your request to add it!