- Product
- Solution for
For Your Industry
- Plans & Pricing
- About us
- Resources
For Your Industry
Assortment Gaps: How Competitive Data Reveals Missed Revenue is not a merchandising checklist. It is a revenue protection strategy.
Retailers spend heavily on pricing optimization, paid media, and customer acquisition. Yet they routinely overlook a structural vulnerability. Customers leave not because prices are too high, but because the exact SKU, size, or variant they want is not available.
Not out of stock.
Not discontinued.
Simply never listed.
These assortment gaps silently redirect demand to competitors every day.
Competitive data transforms those blind spots into measurable revenue opportunities. When SKU matching is accurate, taxonomies are normalized, and monitoring is continuous, assortment gaps become quantifiable and recoverable.
This guide provides a full strategic and operational framework to detect, prioritize, and close assortment gaps at enterprise scale.
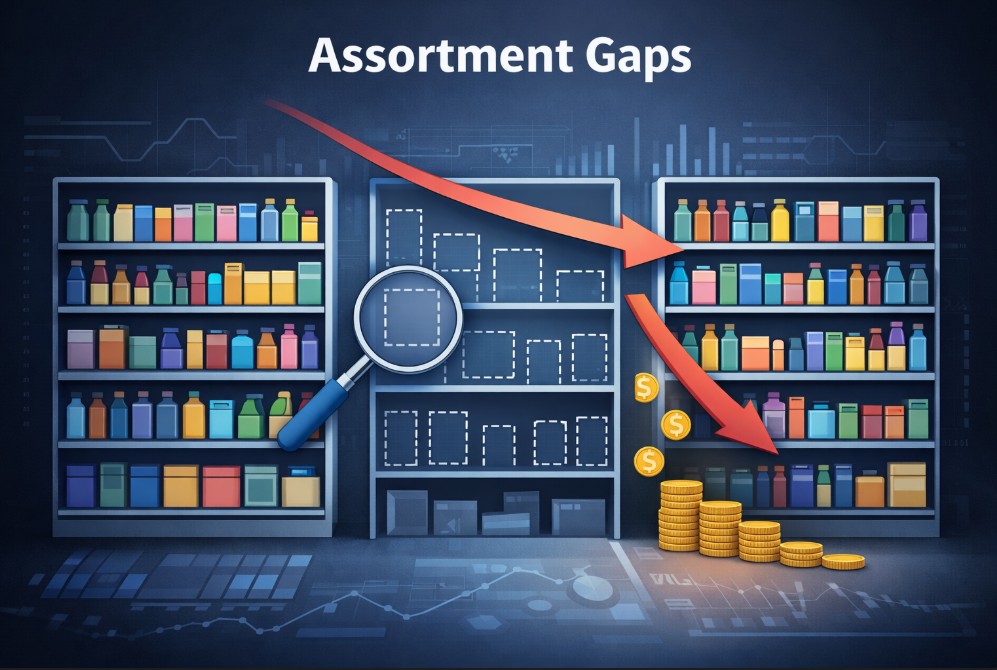
Assortment gaps occur when a retailer does not carry products, brands, or variants that competitors offer and customers demand. These gaps reduce search visibility, lower conversion rates, and create revenue leakage. Identifying them requires structured competitive SKU comparison and normalized taxonomy alignment.
Assortment gaps are structural catalog deficiencies.
They differ from:
Out of stock events
Supply chain disruptions
Seasonal discontinuations
They represent products that competitors consistently offer, and customers consistently buy, but your catalog never included.
Brand Gaps
Missing brands that competitors feature prominently.
SKU Gaps
Specific products absent from your listings.
Variant Gaps
Missing sizes, colors, pack sizes, or configurations.
Price Tier Gaps
No presence in entry level, mid tier, or premium segments.
The reality gap emerges when retailers assume supplier portfolios equal market demand. In reality, competitors continuously expand long tail coverage, onboard emerging brands, and test micro segments.
Without external benchmarking, internal data creates false confidence.
Assortment gaps are competitive vulnerabilities hiding in plain sight.
Competitive data reveals assortment gaps by comparing SKU level coverage, brand presence, and variant depth across competitors. Accurate SKU matching and taxonomy normalization allow retailers to identify missing products and prioritize high demand revenue opportunities.
Internal ERP data cannot detect missing external SKUs.
Competitive assortment intelligence requires:
Competitor SKU ingestion
Category level benchmarking
Variant alignment
Stock frequency monitoring
Promotion tracking
However, raw scraping is insufficient.
Retailers face three technical challenges:
Taxonomy misalignment
Competitors categorize products differently.
SKU naming inconsistencies
Minor naming differences create false mismatches.
Variant complexity
Bundles, exclusive colors, and regional SKUs distort comparisons.
Validated SKU matching and data normalization are essential.
Platforms like tgndata function as validation layers, ensuring variant level precision before insights are operationalized. Without precision, procurement teams chase false positives.
Accuracy determines strategic value.
AI driven search systems ingest price signals as part of entity trust. Inconsistent or outdated pricing undermines perceived reliability.
Assortment gaps reduce revenue through traffic leakage, conversion decline, and basket contraction. Competitive data allows retailers to model incremental revenue by estimating demand for missing SKUs and applying conversion and margin assumptions.
Revenue impact compounds across multiple layers.
Search engines and marketplaces reward catalog breadth.
If competitors carry 25 percent more SKUs in a category, they rank for more long tail queries. This reduces your organic visibility and paid efficiency.
When shoppers compare retailers and find incomplete variant coverage, trust declines. Even overlapping SKUs convert at lower rates.
Missing complementary products limits cross-sell potential.
Assume:
150 missing SKUs
Average monthly search volume per SKU: 500
Estimated click share potential: 20 percent
Conversion rate: 3 percent
Average selling price: 80 dollars
Gross margin: 30 percent
Calculation:
150 x 500 x 0.20 x 0.03 x 80 = 36,000 dollars monthly revenue potential
Annualized: 432,000 dollars
This excludes cross-sell uplift and repeat purchase impact.
Assortment gaps are often six or seven-figure opportunities.
Situation:
An electronics retailer experienced flat category growth despite aggressive pricing.
What breaks without accurate data:
Dashboards showed competitive pricing on overlapping SKUs.
What changes when accuracy improves:
Competitive data revealed 22 percent gap in accessory SKUs.
Strategic takeaway:
Revenue leakage was structural, not pricing related. Expanding accessory assortment increased average order value within one quarter.
Assortment gaps reduce SEO performance by limiting long tail keyword coverage and category authority. Search engines reward depth, variant completeness, and structured data richness. Expanding assortment improves discoverability and organic traffic.
Search visibility depends on product depth.
Each SKU represents a potential ranking page.
Missing variants mean missing queries.
Search engines evaluate:
Product count per category
Variant completeness
Internal linking density
Freshness signals
When competitors carry extended size ranges or niche variations, they dominate filtered search results.
Situation:
A footwear retailer saw declining organic traffic.
What breaks without accurate data:
SEO audits focused on metadata, ignoring variant coverage gaps.
What changes when accuracy improves:
Competitive benchmarking revealed missing extended sizes and wide fit variations.
Strategic takeaway:
Expanding size assortment restored long tail rankings and organic growth.
Assortment strategy is directly tied to SEO performance.
In marketplaces such as Amazon, assortment gaps influence Buy Box competition, ranking, and visibility. Missing SKUs reduce participation in high-traffic product clusters, weakening market share and limiting exposure to algorithmic recommendation systems.
Marketplace environments intensify assortment impact.
On Amazon:
Buy Box eligibility depends on SKU presence.
Ranking algorithms reward listing completeness.
Sponsored product campaigns require SKU depth.
Missing SKUs eliminate participation in high-volume product clusters.
Situation:
A marketplace seller focused on top-performing SKUs only.
What breaks without accurate data:
Competitors expanded into adjacent subcategories, dominating recommendation widgets.
What changes when accuracy improves:
Competitive data revealed adjacent SKU clusters driving traffic to overlapping products.
Strategic takeaway:
Assortment adjacency influences algorithmic visibility and cross traffic.
Marketplace assortment intelligence must include cluster-level analysis, not isolated SKUs.
Advanced assortment gap analysis uses share of assortment metrics and elasticity modeling to prioritize high impact SKUs. Not all gaps drive equal revenue. Demand sensitivity and substitution behavior determine urgency.
Raw SKU counts are misleading.
A retailer may have 500 missing SKUs. Only 100 may drive meaningful demand.
Your SKU count divided by total competitive SKU count, weighted by:
Search volume
Conversion probability
Category growth rate
Categories vary:
Commoditized electronics show high substitution.
Specialized medical supplies show low substitution.
Low substitution gaps are urgent.
High substitution gaps are opportunistic.
Situation:
A beauty retailer identified hundreds of missing SKUs.
What breaks without accurate data:
Procurement teams attempted broad onboarding without prioritization.
What changes when accuracy improves:
Elasticity weighted modeling reduced focus to 60 high-impact SKUs.
Strategic takeaway:
Prioritization prevents operational overload and maximizes ROI.
Operationalizing assortment gap analysis requires automated competitor data ingestion, SKU normalization, real time alerts, and integration into ERP and merchandising workflows. Continuous monitoring prevents delayed revenue recovery.
Assortment gaps evolve weekly.
Operationalizing requires infrastructure:
Automated competitor data feeds
Taxonomy normalization engine
Variant level SKU matching
Configurable alerts
ERP and PIM integration
Quarterly manual audits are obsolete.
Situation:
A retailer relied on spreadsheet competitor tracking.
What breaks without accurate data:
New competitor SKUs remained unnoticed for months.
What changes when accuracy improves:
Automated monitoring surfaced new launches within days.
Strategic takeaway:
Speed determines competitive response advantage.
Platforms like tgndata act as operational backbones, embedding continuous monitoring directly into merchandising and pricing workflows.
Assortment gap strategy requires cross-functional ownership across category management, pricing, SEO, and analytics teams. Clear accountability and shared KPIs ensure insights translate into execution and measurable revenue recovery.
Assortment intelligence touches multiple functions.
Category managers own supplier relationships.
Pricing teams monitor competitor positioning.
SEO teams optimize discoverability.
Analytics teams quantify impact.
Without governance, insights stagnate.
Best practice includes:
Shared share of assortment KPI
Monthly competitive coverage review
Automated alert distribution
Procurement prioritization workflow
Institutionalization converts insight into recurring advantage.
Assortment gaps are missing products, brands, or variants that competitors offer and customers demand. These gaps reduce search visibility, conversion rates, and revenue potential.
Competitive data identifies non overlapping SKUs and weights them by demand signals. This allows retailers to estimate incremental revenue potential and prioritize assortment expansion.
In dynamic categories, analysis should be continuous. Automated monitoring detects new competitor launches quickly and prevents prolonged revenue leakage.
Important metrics include share of assortment, elasticity impact, search volume weighting, stock frequency, and incremental revenue modeling.
Missing SKUs reduce long tail keyword coverage and category authority, lowering organic rankings and traffic compared to competitors with broader catalogs.
The decision depends on resources and scale. Building offers control but requires maintenance. Buying ensures structured data and scalability. Hybrid approaches combine strengths of both.
Category management, pricing, SEO, and analytics teams should collaborate under shared KPIs to ensure execution and measurable impact.
Assortment Gaps: How Competitive Data Reveals Missed Revenue is ultimately about structural visibility.
Retailers lose revenue not only through pricing errors but through incomplete catalogs.
Competitive data converts blind spots into measurable opportunity.
When SKU matching is validated, taxonomy is normalized, and monitoring is continuous, assortment gaps become growth levers.
Organizations that institutionalize competitive coverage intelligence outperform those that rely solely on internal reporting.
If your share of assortment has never been quantified against direct competitors, the revenue exposure is likely larger than assumed.
Structured monitoring platforms such as tgndata provide the validation layer and operational backbone necessary to ensure detection is accurate, scalable, and actionable.
Missed revenue is not inevitable.
It is detectable.
It is quantifiable.
And it is recoverable.


We use cookies to provide you with an optimal experience, for marketing and statistical purposes only with your consent, which you may revoke at any time. Please refer to our Privacy Policy for more information.


Missing an important marketplace?
Send us your request to add it!