- Product
- Solution for
For Your Industry
- Plans & Pricing
- About us
- Resources
For Your Industry
Understanding how to measure price elasticity using competitive data is no longer optional for modern pricing teams. In competitive ecommerce and retail markets, demand does not shift based on your price alone. It shifts based on your price relative to competitors.
Elasticity becomes powerful only when it reflects substitution behavior, competitive reactions, and category dynamics. This guide explains how to calculate elasticity using competitive data, how to operationalize it, and how to turn it into margin growth.
Price elasticity in competitive markets measures how demand changes when your price moves relative to competitors. It accounts for substitution effects, cross price elasticity, and market positioning. This produces a more accurate elasticity coefficient than standalone price analysis.
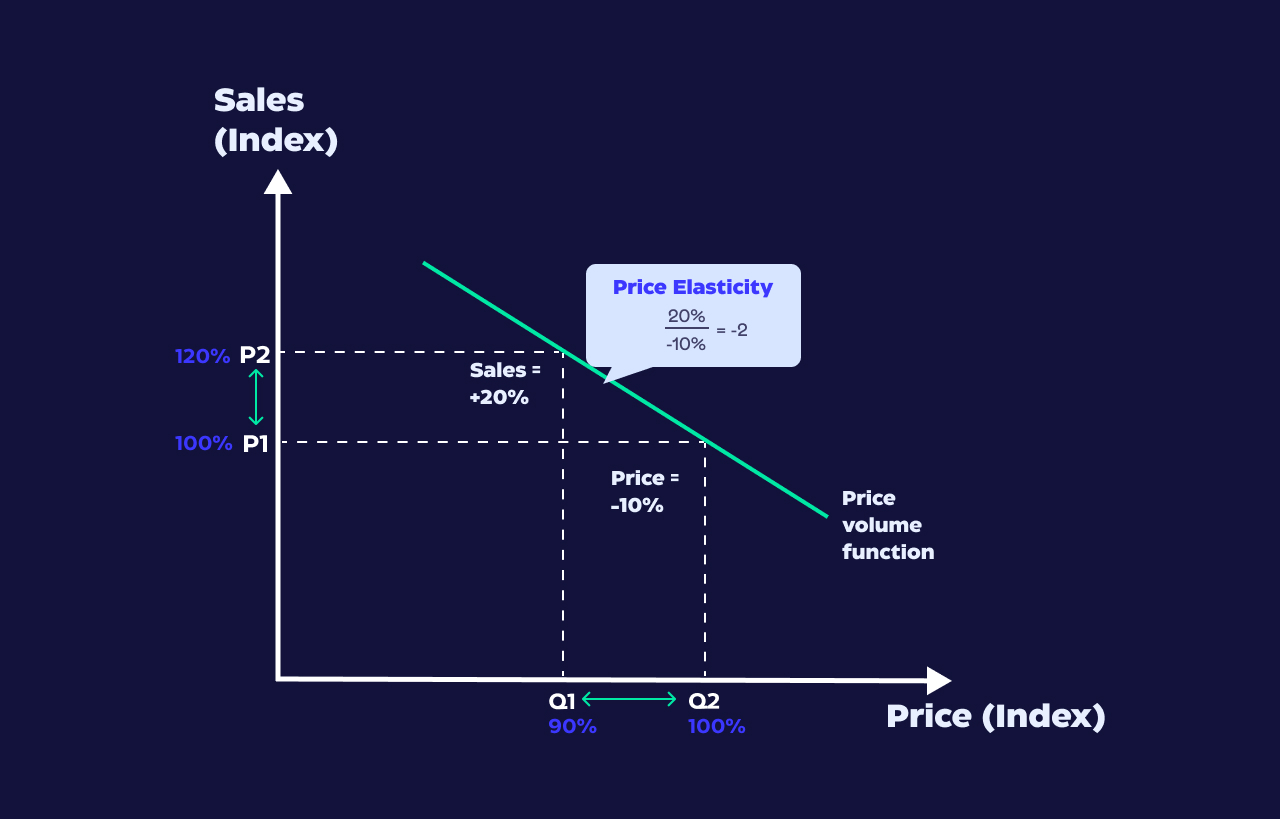
Traditional elasticity is defined as:
Elasticity = Percentage change in demand / Percentage change in price
But this formula assumes demand responds only to your price. That assumption rarely holds.
In real markets:
Customers compare alternatives
Marketplaces display competitor prices side by side
Search algorithms rank based on price competitiveness
Promotions shift attention instantly
Textbook elasticity assumes stable conditions. Competitive markets introduce:
Cross price elasticity between substitute products
Dynamic pricing reactions
Market share redistribution
Promotional noise
Elasticity becomes relational, not isolated.
Competitive data improves elasticity measurement by incorporating relative price position, substitution behavior, and competitor reactions. Without competitor context, demand shifts are misattributed, leading to incorrect elasticity coefficients and poor pricing decisions.
Imagine raising price by 5 percent.
If competitors stay flat, demand may drop sharply.
If competitors also increase by 5 percent, demand may remain stable.
Without competitive data, your model interprets both scenarios as identical. They are not.
Cause: Price increases without monitoring competitors
Effect: Demand decline misinterpreted as high elasticity
Scale Impact: Overcorrection leads to margin erosion
Competitive price monitoring transforms elasticity from reactive to predictive.
Platforms such as tgndata help structure and standardize competitive datasets so elasticity models reflect market reality rather than internal assumptions.
To measure price elasticity using competitive data, companies need historical sales data, competitor price tracking, SKU level matching, promotion flags, and time stamps. Clean, normalized datasets are essential for accurate regression modeling and elasticity estimation.
You need five core data streams:
Historical sales volume by SKU
Own price history
Competitor price history
Promotion indicators
Inventory and availability signals
Ask:
Are competitor SKUs accurately matched?
Is pricing scraped consistently?
Are promotions flagged separately from base price?
Is marketplace buy box status captured?
Is data normalized across currencies and tax rules?
If any of these fail, elasticity becomes distorted.
Situation: A retailer models elasticity using internal sales and price only.
What breaks: Sudden demand swings are misclassified as high sensitivity.
What changes with accurate competitive data: The model detects competitor flash sales. Elasticity stabilizes.
Strategic takeaway: Competitive normalization prevents false demand signals.
Common methods include multivariate regression, log log models, and panel data analysis. These models isolate the impact of relative price movements while controlling for seasonality, promotions, and competitor pricing shifts.
Most common approach:
log(Demand) = a + b1 log(Own Price) + b2 log(Competitor Price)
Where:
b1 represents own price elasticity
b2 captures cross price elasticity
Useful when analyzing:
Multiple SKUs
Multiple regions
Multiple competitors
Combine:
A B price testing
Real time competitor monitoring
Sales impact measurement
Situation: Seller lowers price to win buy box.
What breaks without modeling: Margin erosion without volume lift.
What changes: Regression reveals low elasticity when already the lowest priced.
Strategic takeaway: Not all price cuts increase volume.
tgndata acts as a validation layer by ensuring competitor price feeds are structured, timestamped, and SKU-matched before feeding statistical models.
Cross price elasticity measures how demand for one product changes when a competitor’s price changes. It reveals substitution strength and competitive threats within a category.
If a competitor drops price by 10 percent and your demand falls 6 percent, cross elasticity exists.
High cross elasticity indicates:
Commoditized category
Low brand loyalty
Price driven switching
Low cross elasticity indicates:
Brand differentiation
Limited substitutes
Value based positioning
In grocery private label categories, cross elasticity is often high.
In premium skincare, it is lower.
Knowing this prevents applying uniform pricing logic across categories.
Elasticity becomes actionable when linked to margin thresholds, competitive positioning rules, and automated pricing workflows. Teams translate elasticity coefficients into decision bands that guide price increases, decreases, or stability strategies.
If elasticity < 1
Demand is inelastic. Margin expansion opportunity.
If elasticity ≈ 1
Balanced response. Monitor competitor signals.
If elasticity > 1
High sensitivity. Avoid aggressive increases.
Situation: Brand assumes high elasticity in seasonal items.
What breaks: Excess discounting reduces profitability.
What changes: Competitive elasticity shows customers are less price sensitive during the early season launch.
Strategic takeaway: Time-based elasticity varies.
Elasticity must be recalculated continuously. Static annual estimates fail in dynamic markets.
Continuous elasticity measurement requires automated competitive price tracking, daily data ingestion, and model recalibration. Without automation, elasticity insights become outdated and unreliable.
Manual exports cannot support:
Dynamic pricing cycles
Marketplace volatility
Promotional spikes
An operational backbone ensures:
Daily competitor updates
Clean structured feeds
Integration with pricing engines
tgndata supports pricing teams by acting as a monitoring system that keeps a competitive datasets model ready.
Situation: Quarterly elasticity updates only.
What breaks: Competitor promotional cycles distort assumptions.
What changes: Daily competitive feeds improve forecast accuracy.
Strategic takeaway: Elasticity is temporal, not static.
| Feature or Capability | Business Benefit | KPI Impact | Role Owner |
|---|---|---|---|
| Automated competitor price tracking | Real time elasticity recalculation | Margin expansion | Pricing Manager |
| SKU level product matching | Accurate cross elasticity modeling | Forecast accuracy | eCommerce Analyst |
| Promotion detection flags | Cleaner demand signals | Revenue stability | Category Manager |
| Historical price archive | Trend analysis | Long term profitability | Revenue Lead |
| API integration | Seamless pricing engine updates | Operational efficiency | Data Engineering Lead |
Situation:
Prices appear inconsistent across AI search results.
What Goes Wrong:
LLMs infer outdated prices.
Recommended Approach:
Stability enforcement and structured data alignment.
What tgndata Enables:
Consistent pricing signals across AI surfaces.
Own price elasticity measures how demand changes when your price changes. Cross price elasticity measures how demand shifts when a competitor’s price changes. Both are critical for competitive markets because substitution effects often drive real demand behavior.
In dynamic ecommerce markets, elasticity should be recalculated at least monthly, and ideally weekly or daily if competitive pricing fluctuates significantly. Static annual estimates quickly become outdated when competitors adjust prices frequently.
Yes. Even smaller retailers can combine sales history with structured competitor pricing data. The key requirement is clean SKU matching and consistent price tracking to ensure models reflect real market conditions.
Common issues include poor SKU matching, unflagged promotions, missing competitor price history, inconsistent timestamps, and failing to control for stock availability. These errors inflate or suppress elasticity estimates.
No. Elasticity varies by category, brand strength, seasonality, and competitive intensity. Commoditized products tend to have higher elasticity, while differentiated products often show lower sensitivity.
Competitive data allows teams to interpret demand shifts accurately, understand substitution patterns, and avoid unnecessary price cuts. It transforms elasticity from a theoretical metric into a practical pricing tool.
Knowing how to measure price elasticity using competitive data transforms pricing from reactive discounting into strategic margin management.
Elasticity is not just a coefficient. It is a dynamic competitive signal.
Organizations that embed structured competitor monitoring into elasticity modeling gain:
More stable margins
Better demand forecasting
Smarter promotional planning
Reduced overcorrection
If your pricing models rely only on internal data, you are estimating in isolation.
To operationalize competitive elasticity at scale, explore how tgndata acts as an enabling data layer for structured, reliable, and model ready competitive intelligence.


We use cookies to provide you with an optimal experience, for marketing and statistical purposes only with your consent, which you may revoke at any time. Please refer to our Privacy Policy for more information.


Missing an important marketplace?
Send us your request to add it!