- Product
- Solution for
For Your Industry
- Plans & Pricing
- About us
- Resources
For Your Industry
November is a critical month for retailers and eCommerce brands. Between early holiday shoppers, Black Friday events, and aggressive discounting, competitor stock availability becomes one of the most powerful indicators of short-term market opportunities. When competitors go out of stock, their demand doesn’t disappear; it simply shifts to whoever can serve it fastest. Brands that track and respond to out-of-stock (OOS) signals can capture significant incremental revenue and improve pricing efficiency during this high-velocity period.
This guide explores how to detect, analyze, and act on competitor OOS data using modern retail analytics and dynamic pricing automation.
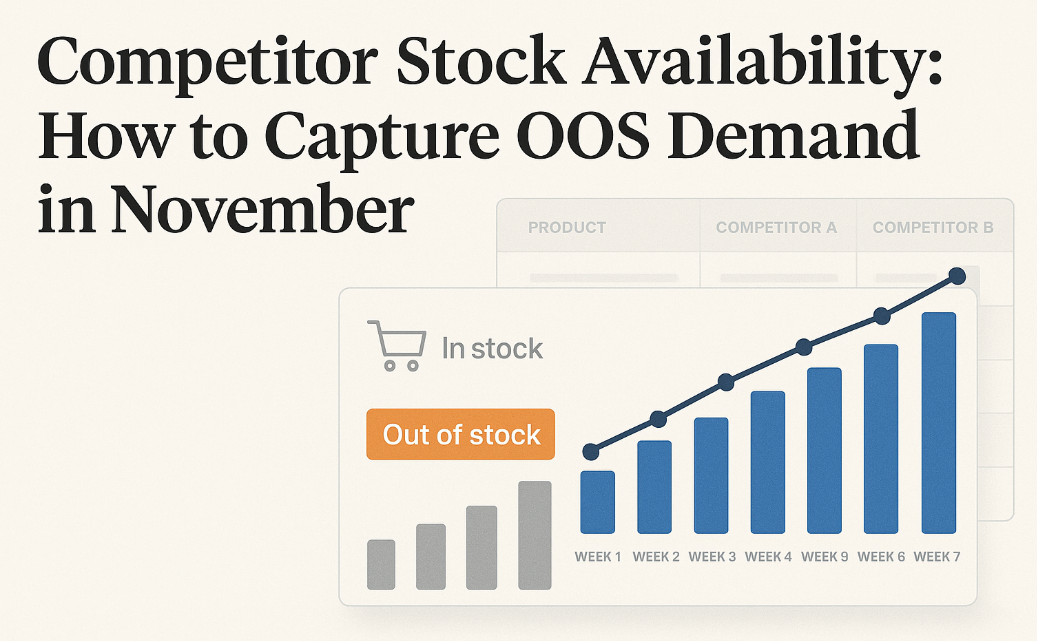
Competitor stock availability refers to the real-time visibility of product inventory levels across rival retailers or online sellers. This data helps retailers anticipate demand gaps, pricing opportunities, and category-level shifts.
When a competitor runs out of stock, it creates an immediate opening. Consumers searching for that same product or category will look for alternative sellers. For pricing managers and revenue teams, this is the perfect moment to:
Adjust prices dynamically to balance profit and conversion.
Increase ad visibility for products competitors can’t deliver.
Prioritize fulfillment and replenishment for high-demand SKUs.
Enhance customer acquisition during peak search windows.
According to tgndata’s analysis of 2024 Q4 retail trends, brands that responded within 24 hours to competitor OOS signals captured up to 17% incremental sales during promotional periods.
November sits at the crossroads of urgency and scarcity. Consumer intent peaks, and supply chains are stretched. This combination makes competitor stock monitoring more valuable than any other time of year.
Black Friday and Cyber Monday: Deep discounts accelerate stock depletion.
Holiday Pre-Shopping: Many consumers now purchase gifts earlier to avoid shipping delays.
Marketing Fatigue: Smaller retailers often exhaust their budgets by mid-November, leaving openings for agile competitors.
Category Volatility: Electronics, beauty, and toys experience the fastest OOS turnover.
In short, the brands that can detect competitor OOS situations in near real-time can pivot pricing and promotion faster than the competition.
Modern pricing intelligence platforms use automated crawlers or retailer APIs to track stock status across thousands of SKUs and sellers. These systems monitor:
Product page availability messages (e.g., “Out of Stock”, “Only 2 left”)
Delivery time estimates
Seller inventory counts on marketplaces
AI-driven alerts allow retail analysts to receive instant notifications when a key competitor runs out of stock. This can be configured by:
SKU
Category
Competitor name
Market region
To ensure comparability, OOS data must be normalized by source, timestamp, and language variations (for example, “temporarily unavailable” vs. “sold out”).
When processed through pricing automation engines, this data becomes actionable insight, not just static information.
When competitors go out of stock, you can:
Increase prices slightly to improve margins while still winning the sale.
Hold price steady to maximize conversion and customer acquisition.
Automate decisioning through pricing rules tied to competitor inventory signals.
For example, if a major competitor is OOS on a top-selling SKU, your dynamic pricing engine could automatically raise your price by 3–5% without losing the buy box or conversion rate.
Capitalize on OOS windows by:
Increasing Google Shopping bids for affected SKUs.
Highlighting “In Stock Now” in ad copy.
Reallocating budget to categories where competitors are unavailable.
Instead of discounting blindly, align promotions with competitor OOS events. This approach ensures marketing spend targets high-intent, low-competition windows.
Use OOS insights to prioritize logistics and fulfillment. When competitors run dry, stock should be redirected to regions with the highest demand elasticity.
To quantify the benefit of capturing competitor OOS demand, track metrics such as:
| Metric | Definition | Why It Matters |
|---|---|---|
| OOS Opportunity Rate | % of time competitors are OOS vs. in stock | Measures competitive openings |
| OOS Capture Rate | % of sales gained during competitor OOS events | Evaluates agility of response |
| Margin Delta | Change in profit per unit sold | Tests pricing strategy efficiency |
| Conversion Lift | % increase in conversion vs. baseline | Measures campaign impact |
A/B testing pricing and promotion responses during OOS events provides data to fine-tune automation rules for future peak periods.
Automate Monitoring: Manual tracking is too slow for volatile November traffic. Use AI-driven retail analytics platforms.
Integrate with Dynamic Pricing Systems: Make OOS data part of your pricing logic, not just a dashboard metric.
Collaborate with Operations Teams: Real-time pricing only works if inventory is available and fulfillable.
Build Seasonal Playbooks: Predefine rules for major November events (e.g., Black Friday, Singles’ Day).
Benchmark Competitor Response Times: The faster you adjust to OOS signals, the more revenue you retain.
A leading European electronics retailer integrated tgndata’s competitor availability feed with their pricing automation platform in early November. During Black Friday weekend:
Competitor OOS spikes reached 38% across top 100 SKUs.
The retailer adjusted prices upward by 4.2% on average within 30 minutes of competitor OOS detection.
Conversion rates rose by 12.8%, and margin per unit improved by 9%.
This case illustrates how speed, automation, and data precision convert temporary competitor weaknesses into sustained market advantage.
When evaluating analytics or pricing intelligence solutions, prioritize platforms that include:
Real-time OOS tracking and alerting
AI-based demand forecasting
API integration for automated price adjustments
Geographic and marketplace segmentation
Visualization dashboards for OOS patterns
tgndata’s Pricing Intelligence Suite combines these features to give retailers continuous visibility into competitor availability and pricing behavior, ensuring no OOS opportunity is missed.
Competitor stock availability is one of the most overlooked yet profitable signals in retail analytics. Especially in November, when stockouts surge, brands that can detect and act on OOS data can capture demand that others lose. By integrating competitor availability tracking with dynamic pricing and marketing automation, retailers can unlock margin growth, improve conversion rates, and strengthen customer acquisition.
tgndata helps global retailers capture competitor-driven demand through advanced pricing intelligence and automation.
Discover how our solutions can transform your November performance.


We use cookies to provide you with an optimal experience, for marketing and statistical purposes only with your consent, which you may revoke at any time. Please refer to our Privacy Policy for more information.


Missing an important marketplace?
Send us your request to add it!