- Product
- Solution for
For Your Industry
- Plans & Pricing
- About us
- Resources
For Your Industry
In the era of AI-powered dynamic pricing and real-time market competition, pricing managers face an unprecedented challenge: maintaining profitability, competitiveness, and customer trust — all at once.
The solution lies in data visibility.
Tracking the right Key Performance Indicators (KPIs) daily helps pricing teams detect shifts early, adapt faster, and prevent small pricing errors from becoming costly revenue leaks.
But with dozens of metrics available, which ones truly define success?
This article highlights the four KPIs every pricing manager should monitor daily — metrics that go beyond traditional financials to capture performance, perception, and precision.

The Price Index measures how your prices compare to competitors’ prices for similar products. It’s typically expressed as a ratio or percentage — showing whether your pricing sits above, below, or at par with the market.
Formula:
(Your Price ÷ Average Competitor Price) × 100
If your price index is 105, you’re priced 5% higher than the market average; if it’s 95, you’re 5% cheaper.
Markets change quickly — especially in eCommerce, hospitality, and retail sectors where automated repricing is the norm. A daily review of your price index helps you:
Identify when competitors lower or raise prices.
Prevent unintentional price gaps that erode sales.
Maintain strategic alignment with your pricing position (premium, parity, or budget).
Integrate real-time competitor monitoring tools (like tgndata’s Price Intelligence Module).
Use alerts for deviations beyond your tolerance range.
Combine this KPI with elasticity and conversion metrics to understand not just where you stand — but how customers respond.
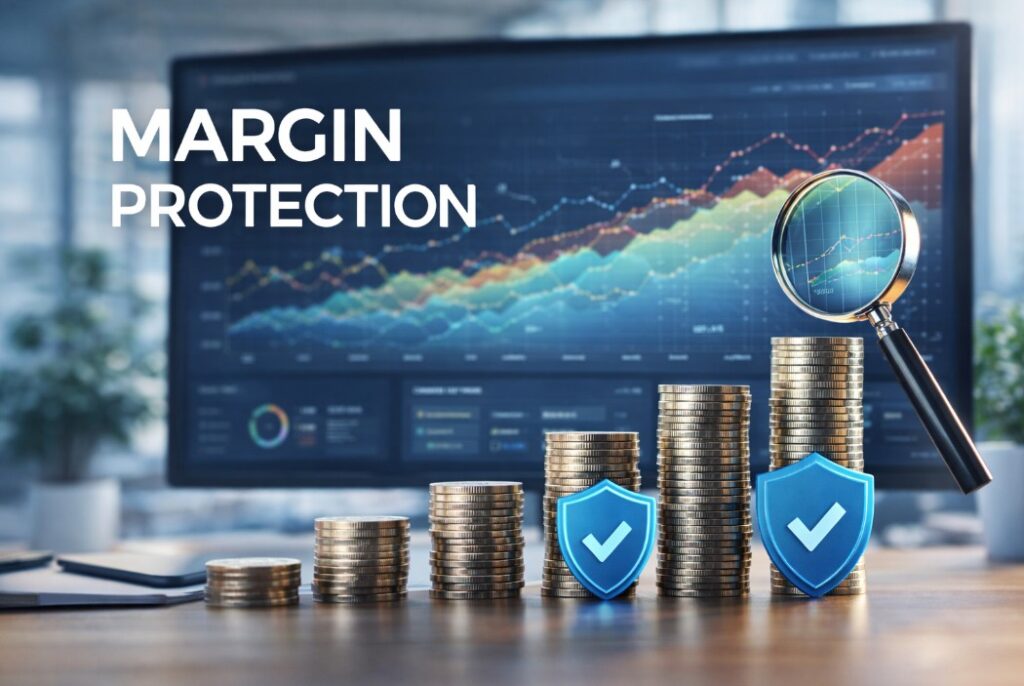
The Gross Margin KPI measures the difference between selling price and cost of goods sold (COGS). It indicates how efficiently your pricing strategy protects profitability.
Formula:
(Revenue – Cost of Goods Sold) ÷ Revenue × 100
While it seems straightforward, daily margin monitoring uncovers deeper insights about price effectiveness, discount strategies, and market resilience.
Even small daily fluctuations in cost or discount rates can significantly impact monthly performance. Without daily visibility:
Margin compression may go unnoticed.
Discounts may outpace value perception.
Product lines may appear profitable on average — but underperform in reality.
Track margin by product, category, and region.
Identify where high sales volume masks low profitability.
Correlate margin data with price index movements to see if competitiveness is compromising returns.
A retailer sees a 3% drop in gross margin despite stable demand. A quick check of price index data reveals a competitor’s deep discount campaign. Instead of matching the price, the team recalibrates bundles and cross-sells — preserving brand value and margin integrity.
Price elasticity measures how demand changes in response to price variations. It’s one of the most critical, yet often overlooked, KPIs for pricing managers.
Formula:
(% Change in Quantity Sold ÷ % Change in Price)
Elasticity helps determine how sensitive customers are to price adjustments — enabling managers to avoid over-discounting or overpricing.
Elasticity is not static. It shifts with:
Seasonality and promotions.
Competitor pricing strategies.
Macroeconomic trends and consumer sentiment.
Monitoring it daily allows for real-time fine-tuning of prices and promotional intensity.
Combine historical data with live sales performance.
Use machine learning models to predict elasticity changes.
Segment elasticity by product type, region, and customer cohort.
Pro Tip:
tgndata’s AI-driven elasticity model automatically detects shifts in sensitivity, alerting pricing teams when markets become more price-conscious — so you can act before revenue dips.
While profitability and competitiveness are vital, price perception — how fair and transparent customers perceive your prices to be — determines long-term brand loyalty.
In the age of comparison shopping and social transparency, customer perception directly influences conversion rates and repeat purchases.
Price perception can be quantified through:
Customer surveys or NPS overlays on pricing experience.
Social sentiment analysis on pricing-related feedback.
Review mining for mentions of “expensive,” “value,” or “fair.”
Tracking perception daily helps you:
Detect customer frustration with price volatility.
Identify when dynamic pricing feels “unfair” or inconsistent.
Balance algorithmic optimization with human empathy.
A fair price isn’t always the lowest — it’s the one customers understand and accept.
When tracked together, these four KPIs form the foundation of a continuous pricing optimization system:
| KPI | Core Purpose | Key Question It Answers |
|---|---|---|
| Price Index | Competitiveness | Are we priced correctly against the market? |
| Gross Margin | Profitability | Are we balancing price and cost effectively? |
| Elasticity | Responsiveness | How do customers react to our price changes? |
| Perception Score | Fairness | Do customers trust our pricing strategy? |
These metrics connect the three pillars of modern pricing strategy:
Data accuracy — reliable inputs for decision-making.
Algorithmic insight — using automation without losing context.
Human oversight — ensuring brand consistency and ethics.
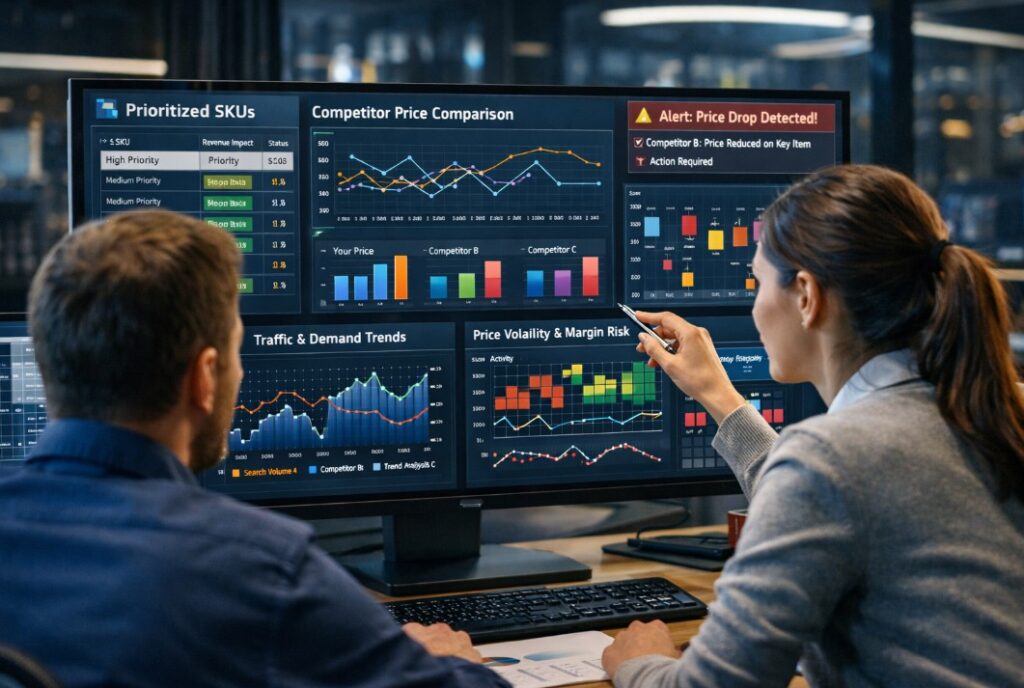
Modern pricing platforms like tgndata’s Pricing Intelligence Suite combine automation and analytics to:
Stream data from sales, competitors, and customer channels.
Detect anomalies across KPIs.
Recommend price adjustments proactively.
By embedding AI, pricing managers move from reactive monitoring to predictive pricing management — where the system flags issues before performance declines.
An ideal dashboard should:
Refresh automatically with real-time inputs.
Offer drill-down capabilities (by category, region, or channel).
Highlight KPI interactions, e.g., how price index shifts affect gross margin.
Daily visibility empowers proactive strategy, not reactive firefighting.
Tracking too many metrics: Dilutes focus. Stick to the top 4–6 actionable KPIs.
Relying on lagging indicators: Focus on real-time and leading indicators instead.
Ignoring data quality: KPI insights are only as strong as the underlying data.
Not linking KPIs to decisions: A KPI is valuable only if it changes what you do.
As a rule: If a KPI doesn’t influence action within 24 hours, it shouldn’t be tracked daily.
The best pricing teams treat KPI tracking as an always-on process, not a periodic review.
Each data point fuels feedback loops:
Elasticity informs margin decisions.
Margin shifts influence pricing rules.
Price perception shapes brand communication.
In other words, KPIs aren’t dashboards — they’re decision engines.
In today’s data-driven pricing environment, tracking the right KPIs daily isn’t optional — it’s strategic survival.
Price competitiveness, margin strength, elasticity awareness, and perception trust are the four cornerstones of modern pricing intelligence. Together, they enable pricing managers to make decisions that are not just reactive, but predictive.
Because in fast-moving markets, success doesn’t come from setting prices — it comes from understanding what the data is telling you, every single day.
At tgndata, we empower that understanding.


We use cookies to provide you with an optimal experience, for marketing and statistical purposes only with your consent, which you may revoke at any time. Please refer to our Privacy Policy for more information.


Missing an important marketplace?
Send us your request to add it!