
- Product
- Solution for
For Your Industry
- Partners
- Plans & Pricing
- Resources

For Your Industry
Ecommerce pricing statistics for Europe show a market worth €911 billion in 2025 and forecast at €961 billion in 2026, but real growth is only 3% to 4% after inflation, 78% of EU internet users already buy online, and three in ten checked traders showed discounts incorrectly. tgndata, price intelligence software for retailers and brands, compiled 40 sourced data points from Eurostat, the European Commission, the ECB, Ecommerce Europe, Deloitte, McKinsey and national retail bodies so that pricing teams can cite one current reference instead of twenty tabs.
European B2C ecommerce is forecast at €961 billion in 2026, up 5% in nominal terms but only about 3% after inflation, according to the European E-commerce Report 2026. The seven figures below set the baseline for every pricing decision that follows.
1. €911 billion of turnover in 2025. European B2C ecommerce grew 7% in 2025, from €842 billion to €911 billion, according to the European E-commerce Report 2026 published by Ecommerce Europe and EuroCommerce. The report covers 38 countries and draws on Eurostat, the IMF, national statistics offices, Statista and national ecommerce associations.
2. €961 billion forecast for 2026. The same report expects turnover to rise 5% to €961 billion in 2026. Within the EU-27, turnover reached €715.8 billion in 2025 and is forecast at €757.3 billion in 2026, a 6% increase.
3. Real growth is much lower than nominal growth. After 2.6% average inflation, European B2C ecommerce grew 4% in real terms in 2025 against 7% nominal. Eastern Europe shows the gap most clearly: 14% nominal growth shrinks to 5% after inflation of 8.4%. For 2026 the report forecasts 3% real growth on 2.8% assumed inflation.
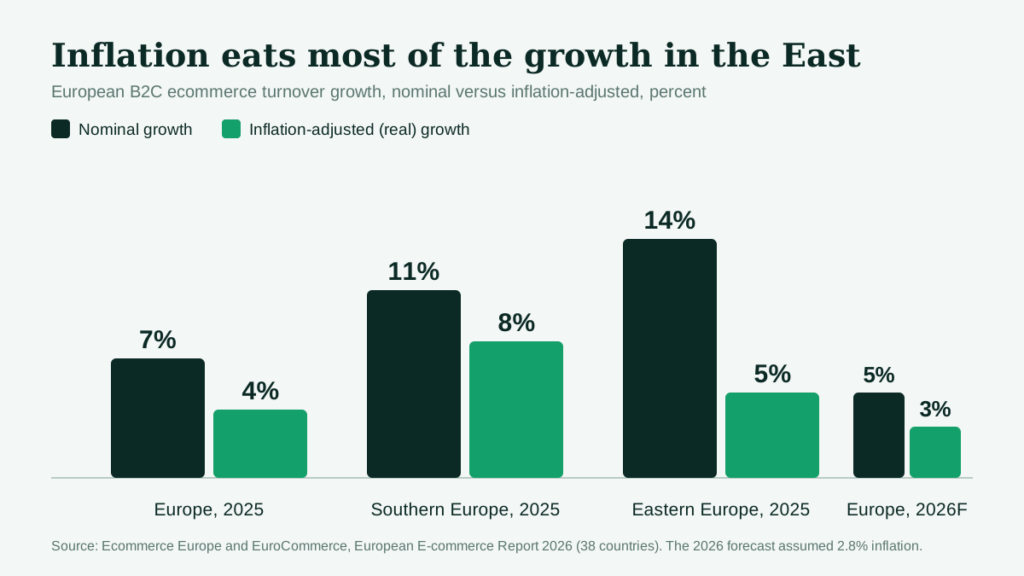
4. Western Europe holds 57% of turnover but grows slowest. Western Europe reached €523.1 billion in 2025, 57% of the European total, and grew 5%. Northern Europe grew 6% to €69.5 billion, Central Europe 8% to €92.9 billion, Southern Europe 11% and Eastern Europe 14%.
5. Online is still only 18.2% of European retail. ECDB, a market intelligence provider, estimates European ecommerce sales at $895 billion in 2026, up 8.5%, and an online share of retail of 18.2%, up from 17.3% in 2025. ECDB puts Asia at 30.4% and North America at 27.7% for 2026. ECDB reports in US dollars and uses its own scope, so do not mix its totals with the Ecommerce Europe euro figures.
6. Electronics and fashion lead, and Amazon leads both. ECDB reports electronics at $191 billion and fashion at $188 billion in European sales in 2025, with hobby and leisure third at $176 billion. Amazon is the largest online retailer by gross merchandise value in the UK, Germany, France, Spain and Italy. In Germany the top five stores take 54% of the sales of the top 250, and in France 46%.
7. Five Western markets still dominate, while the edges grow fastest. Tradebyte analysed transaction data from more than 1,000 brands and more than 90 retailers on its platform. Germany, France, Belgium, the Netherlands and Switzerland made up over 73% of 2025 gross merchandise value in that network. Central and Eastern Europe grew 59% and the Nordics 37%. Luxembourg, Norway, Cyprus, Greece and Portugal each grew by more than 100% from a smaller base.
Methodology. Figures 1 to 4 come from the executive summary of the European E-commerce Report 2026 as published by Handelsverband Swiss in September 2026. We did not read the full PDF, so country tables beyond the summary are not used. Figures 5 and 6 come from ECDB’s Ecommerce in Europe 2026 study as reported by Marketing4eCommerce on September 3, 2026. Figure 7 comes from Tradebyte’s E-Commerce in 2026 report, published in January 2026, and reflects Tradebyte’s own network, not the whole market.
The takeaway for pricing teams: volume growth in Europe is now thin, so margin and share decisions matter more than market growth.
78% of EU internet users aged 16 to 74 bought something online in 2025, so growth now comes from shopper frequency and share, not from new buyers. The country figures below show how uneven that average is.
8. 78% of EU internet users bought online in 2025. Eurostat reports 77.8%, up from 76.6% in 2024, based on a 2025 survey of around 330,000 respondents aged 16 to 74, mostly collected in the second quarter. Ecommerce Europe uses a different base. It counts 75% of all people aged 16 to 74 across 38 European countries as online shoppers, and 72% within the EU-27.
9. The country spread is 38 points. Ireland leads at 95.3% of internet users, followed by the Netherlands at 94.4% and Denmark at 91.2%. At the bottom are Romania at 63.6%, Italy at 61.7% and Bulgaria at 57.0%, according to Eurostat figures reported by Ecommerce News.
10. Spend per head differs by a factor of three. Denmark had the highest B2C ecommerce turnover per capita in 2025 at €4,456, followed by Estonia at €4,252 and Ireland at €3,123. Luxembourg, despite the highest GDP per capita in the sample, recorded only €1,539 per person, according to Ecommerce Europe.
11. 35.4% of regular online shoppers had a problem. Eurostat’s 2025 data shows that 35.4% of regular EU online shoppers hit an issue, up from 33.1% in 2023. Slow delivery was the most common problem at 20%. Malta (64%) and the Netherlands (58%) report the most problems, while Greece (11%) and Portugal (5%) report the fewest.
12. German online sales reached €92.3 billion. The HDE, Germany’s retail association, reports net online sales of €92.3 billion in 2025, up 3.9%, against 2.9% for stationary retail. HDE forecasts 4.3% online growth in 2026 against 1.6% in stores. Online grocery and drugstore sales grew 10.4% but hold only a 4.9% online share.
13. Dutch online spend dipped 1% to €35.7 billion. The Thuiswinkel Markt Monitor, run by NielsenIQ for Thuiswinkel.org, shows that product spending grew 2% while services fell. Foreign webshops took 13% of spend, €4.5 billion, with 44.8 million purchases, up 9%. In the first half of 2026, 14% of Dutch online purchases went abroad. Germany took 26 cents of every euro spent abroad and China 5 cents.
14. Greek shoppers are catching up while sellers lag. ELSTAT data reported by To Vima shows that 69.2% of Greek internet users made online purchases in the first quarter of 2025, up 6.4 percentage points on 2024. Only 25.8% of Greek businesses accept electronic orders from customers.
Methodology. Figures 8 and 9 use the Eurostat 2025 release on individuals’ internet use, published in late 2025 and summarised by Ecommerce News and E-commerce Germany. Figure 10 comes from the Ecommerce Europe report. Figure 11 is Eurostat 2025 data on problems reported by regular online shoppers, as reported by Ecommerce News. Figures 12 to 14 come from the HDE Online-Monitor 2026 (June 2026), the Thuiswinkel Markt Monitor full-year 2025 and first-half 2026 reports, and ELSTAT figures published in January 2026.
The takeaway for ecommerce managers: your next customer is already online, so price and delivery promise decide who wins them.
In Germany, 56.7% of online sales run through marketplaces, and cross-border platforms from China are adding a new price floor that the EU is now taxing. Pricing teams need marketplace and cross-border visibility, not only competitor webshop prices. tgndata’s guide to marketplaces in Europe lists the platforms worth monitoring.
15. 56.7% of German online sales run via marketplaces. The HDE Online-Monitor 2026 puts the marketplace share at 56.7% in 2025. The bevh, Germany’s ecommerce association, reached a similar 56% or €46.2 billion on a different definition.
16. Temu and Shein took about €4.7 billion in Germany. HDE estimates that foreign online sellers generate just under €11 billion in Germany, of which roughly €4.7 billion, around 5% of online sales, goes to Temu and Shein.
17. One in 15 German online orders goes to an Asian platform. The bevh reports gross goods sales of €83.1 billion in 2025, up 3.2%. Platforms of Chinese origin delivered 30% of the €2.6 billion of growth.
18. Marketplace dependence varies from 17% to 87% by country. Among EU enterprises with 10 or more employees that sell online, 87% in Lithuania, 65% in Italy and 64% in Poland sell via marketplaces. In Estonia the share is 17%, according to Ecommerce Europe.
19. More than half of euro area consumers have used Chinese platforms. The ECB’s April 2026 Consumer Expectations Survey found that more than half of respondents have used them. Use is above 70% in Greece, Portugal and Spain and below 50% in Germany and France. Price dominated the open-text reasons, followed by product variety.
20. Orders are small and frequent. In the same ECB survey, almost two thirds of orders were worth no more than €25 and 90% no more than €50. One in five respondents shops on these platforms at least once a month.
21. A €3 duty has applied since July 1, 2026. The EU replaced the duty exemption for parcels under €150 with a temporary flat duty of €3 per product category, running to July 1, 2028 and extendable. It raises landed prices most for the cheapest items.
22. Low-value parcel volumes are very large. The ECB, citing the European Commission, reports that about 90% of shipments up to €150 entering the EU in 2024 came from China, and that item volume rose from 1.9 billion in 2023 to 4.17 billion in 2024. Separate reporting on the duty puts 2025 at 5.8 billion low-value parcels, roughly 15.9 million a day. The two figures come from different publishers and may count differently.
Methodology. Figures 15 to 17 come from the HDE Online-Monitor 2026 (June 3, 2026) and the bevh review of 2025 (January 2026). Figure 18 comes from the Ecommerce Europe report, using EU-27 data on enterprises with web sales. Figures 19 and 20 come from the ECB blog of July 13, 2026, based on the April 2026 survey wave. Figures 21 and 22 come from EU announcements and press coverage in June and July 2026.
The takeaway for marketplace and brand managers: monitor the marketplace price, not just the webshop price, and watch how the €3 duty changes the landed price of cheap competitors.
Euro area inflation reached 4.0% in October 2026, well above the 2.8% that the European E-commerce Report 2026 used for its forecast. Cost pass-through is back on the pricing agenda. Our guide to margin protection in ecommerce during cost volatility covers the rules that keep margin intact when costs move fast.
23. Inflation is at its highest in over three years. Eurostat’s flash estimate of November 4, 2026 puts euro area inflation at 4.0% for October, up from 3.8% in September and 3.2% in August. Energy inflation was 20.8%, services 3.3% and food, alcohol and tobacco 1.6%.
24. Greece is above the euro area average. Greek inflation was 5.6% in the October flash estimate, behind only Lithuania at 6.1% and Bulgaria at 6.0%, as reported from the Eurostat release.
Methodology. Both figures come from Eurostat’s flash estimate released on November 4, 2026, which is an early estimate that Eurostat revises. Final October data is due on November 18, 2026. We could not open the Eurostat page directly because of a server error on the day of writing, so the Greek country figure relies on secondary reporting of the release. Check both numbers against the final release before quoting them.
The takeaway for pricing managers: when inflation runs ahead of the forecast, the cost of a slow or mismatched price update goes up. Our guide on how often to update prices in ecommerce sets out cadence by category volatility.
Price gap alerts are worth setting when the gap between your price and the market crosses a threshold that affects competitiveness or margin. These alerts help teams avoid being too expensive or unnecessarily cheap.
Useful price gap alerts include:
A category manager for consumer electronics might set an alert when the retailer becomes more than 5 percent higher than the average of three priority competitors on high-traffic products. The same team may also set an alert when products are more than 10 percent below market, because that could signal margin leakage.
Price gap alerts help teams protect competitiveness and avoid unnecessary discounting.
Black Friday discounts in Germany were shallow in 2025, with an average of 7% before the event and 5.1% more during Black Friday week, while European online sales still outgrew other regions. The data suggests that event pricing is decided before the event, a point we cover in our Black Friday price monitoring playbook.
29. German discounts were shallow and started early. DataWeave analysed 16,653 SKUs across five categories in Germany for the week of November 24 to December 1, 2025. Discounts averaged 7% before Black Friday and added 5.1% during the week. The average German Black Friday budget was €317, the highest among the European countries DataWeave compared. DataWeave sells competing price monitoring technology, so treat this as a neutral data point rather than an endorsement.
30. Europe led Cyber Week growth. Salesforce reported that European Cyber Week sales grew 12% year on year in 2025, ahead of North America at 5% and Asia Pacific at 3%, as reported by Modern Retail. Globally Cyber Week reached $336.6 billion, up 7%.
31. Return rates above 50% change the margin maths. Tradebyte benchmarks show return rates above 50% in Germany, Switzerland and Austria, against about 14% in the UK. Tradebyte expects many retailers to end free returns in 2026. A discount that looks profitable at checkout can lose money after a return.
Methodology. Figure 29 is a DataWeave analysis published on December 16, 2025 covering Germany only. Figure 30 is a Salesforce Cyber Week 2025 reading as reported in December 2025. Figure 31 is from the Tradebyte report of January 2026, drawn from its own network.
The takeaway for category managers: model discount depth after returns, and set the event price before the event starts.
56% of European consumers have used AI to shop at least once, and price comparison is the most common thing they do with it. That makes price consistency across your channels a visibility factor. tgndata covers the mechanics in AI shopping agents: how they compare your prices.
32. 56% of Europeans have shopped with AI. Deloitte surveyed 13,500 consumers in 15 European countries in May 2026, including 1,500 in Germany. 56% had used AI to shop at least once. In Germany the figure was 52%.
33. Comparison is the lead use in McKinsey’s data. In a McKinsey European consumer survey, 63% of respondents reported using AI to compare options such as brands, models, prices and reviews. McKinsey’s text does not state the base for that figure, so read it as the share reporting the use in its chart. Separately, McKinsey’s ConsumerWise survey found that 74% of Italian, 67% of UK, 66% of German, 63% of French and 59% of Spanish consumers used an AI tool in the last three months.
34. Price comparison tops the use list in every region. The World Retail Congress and Vercel surveyed 4,000 shoppers in nine European countries in May 2026. Among respondents who use AI for shopping, 51% to 55% used it to compare prices, the top use in every region. Between 19% and 27% start shopping journeys on AI search.
35. French users lean on AI for price, but do not hand over the purchase. Idealo and Kantar surveyed more than 10,000 people aged 18 to 64 in France, Germany, Austria, Spain, Italy and the UK in May 2026. In France 38.7% had used AI for online shopping, and 55.5% of those named price comparison as the main use. 51.8% would not delegate the whole journey, against 32% who would. Idealo operates a price comparison site, so its interest in the topic is direct.
36. In Norway, price share fell and AI price checks rose. KPMG and Norstat’s RetailPuls 2026 surveyed 1,000 Norwegian consumers in March 2026. 35% said price matters most, down from 44% in 2025, and 29% said quality. In electronics 45% named price and 44% quality. 55% want AI agents to compare prices across sites. Norway is not in the EU, so this is a European, not an EU, data point.
Methodology. All five studies are self-reported consumer surveys with different samples, base definitions and fieldwork dates in the first half of 2026. They are not directly comparable and are best read as a consistent direction, not a single adoption rate. The World Retail Congress and Vercel figures are reported by a secondary publisher.
The takeaway for ecommerce managers: AI assistants read the prices you publish, so inconsistent prices across channels cost you in a place you cannot see.
61% of surveyed European retailers use some form of dynamic pricing, yet fewer than 15% use algorithmic or AI-based models, and most struggle to turn competitor data into action. The gap between collecting data and using it is where ecommerce pricing intelligence pays back.
37. 61% use some dynamic pricing, under 15% use AI-based models. Valcon polled 350 European retailers and found that 61% use a form of dynamic pricing, such as heuristic or automated rules. Fewer than 15% use algorithmic or AI-based dynamic pricing. 55% planned to pilot AI or generative AI pricing in 2025. The poll was published in January 2025, so adoption is likely higher now.
38. 72% of retailers call pricing a strategic priority. PricingHUB and the retail consultancy Diamart surveyed French retail decision-makers for their 2026 study. 72% treat pricing as a strategic priority, 10% more than the year before. Nearly 30% have not invested in a dedicated pricing solution. The study does not publish a sample size in its summary.
39. 83% value price sensitivity, 11% use it. In the same study, 83% of retailers recognise the importance of consumer price sensitivity, but only 11% integrate it into practice. Nearly three quarters lack tools that bring elasticity into pricing.
40. 94% collect competitor data, nearly half match products by hand. In the same study, 94% of retailers collect competitive data, yet nearly one in two still matches products manually, and all admit their matching and assortment alignment is incomplete. Our guides on how product matching works and the pricing data quality guide explain why matching accuracy decides whether competitor prices are usable.
Methodology. Figure 37 is a Valcon poll of 350 retailers across Europe published in January 2025. Figures 38 to 40 are from the PricingHUB and Diamart study of French retail decision-makers, published in February 2025 for the 2026 outlook. Both firms sell pricing services, and the French sample may not represent Germany, the Benelux countries or Greece. In the Tradebyte report, the CEO of 7Learnings said that Gartner rates pricing as the AI use case with the best impact-to-effort ratio.
The takeaway for commercial directors: most retailers already collect competitor prices, so the advantage is in matching quality and acting on the data quickly.
Slow real growth, faster inflation and stricter rules mean pricing teams should prioritise data quality, price history and cadence over adding more data sources. Here is how the numbers translate by role.
Pricing Managers
Ecommerce Managers
Category Managers
Brand and Marketplace Managers
Commercial Directors
tgndata is price intelligence software for retailers and brands. Its price monitoring platform covers competitor price monitoring, availability and promotions across webshops and marketplaces, and its dynamic pricing software applies your rules. Our overview of price intelligence software explains how the pieces fit.
The takeaway: in a market that grows 3% in real terms, accurate and fast pricing decisions are the main lever you control.
The headline numbers are €911 billion of B2C ecommerce turnover in 2025 and a €961 billion forecast for 2026, according to Ecommerce Europe and EuroCommerce. Real growth is only 3% to 4% after inflation, 78% of EU internet users bought online in 2025 per Eurostat, and euro area inflation reached 4.0% in October 2026. For pricing teams, the most actionable figure is that 30% of 314 checked traders showed discounts incorrectly in the Commission’s Black Friday sweep.
Ecommerce Europe and EuroCommerce forecast European B2C ecommerce turnover of €961 billion in 2026, up 5% from €911 billion in 2025. Other publishers use different scopes and currencies, for example ECDB estimates $895 billion and IBISWorld estimates €353.5 billion for a narrower industry definition. Always compare figures from the same source.
Eurostat reports that 78% of EU internet users aged 16 to 74 bought something online in 2025, up from 76.6% in 2024. Ecommerce Europe counts 75% of all people aged 16 to 74 across 38 European countries and 72% in the EU-27, because it uses the whole population as the base. Country gaps are wide, from 95.3% in Ireland to 57.0% in Bulgaria.
When a trader announces a price reduction, the reference price must be the lowest price applied in the previous 30 days, under the Price Indication Directive. A Commission sweep of 314 online traders during Black Friday and Cyber Monday 2025 found that 30% presented discounts incorrectly. Retailers need price history they can prove, not only a current price feed.
Euro area inflation rose to 4.0% in October 2026 according to Eurostat’s flash estimate, driven by energy at 20.8%. That is well above the 2.8% inflation that the European E-commerce Report 2026 assumed for its forecast, so the forecast 3% real growth now depends on nominal sales keeping pace with faster price rises. Pricing teams face cost pass-through decisions at the same time as consumers compare prices more actively.
Deloitte found that 56% of European consumers have used AI to shop at least once, based on 13,500 consumers in 15 countries surveyed in May 2026. A World Retail Congress and Vercel survey of 4,000 shoppers found that price comparison was the top AI shopping use in every region, cited by 51% to 55% of AI shoppers. Because AI assistants compare listed prices, consistent and current price data across channels matters more.
We use cookies to provide you with an optimal experience, for marketing and statistical purposes only with your consent, which you may revoke at any time. Please refer to our Privacy Policy for more information.










Missing an important marketplace?
Send us your request to add it!