- Product
- Solution for
For Your Industry
- Partners
- Plans & Pricing
- Resources

For Your Industry
Assortment optimization is the discipline of deciding which products to carry, how deep to stock them and where to price them against the market, and with Black Friday on 27 November 2026 it is one of the few levers that still moves results for European retailers and brands. Bain forecasts holiday sales growth of just 3.5% in the UK, 2.5% in France and 2.0% in Germany this year, with most of the gain coming from inflation rather than volume, according to its 2026 European Holiday Shopping Outlook. At the same time, BCG’s Black Friday Consumer Study found that about 77% of shoppers across its 10 markets, seven of them in Europe, sometimes or often delay purchases to wait for year-end sales. When volume is flat and shoppers wait for the deal, the range you carry decides how much of the season’s spend you can win without discounting. This guide explains what assortment optimization is, what it delivers for retailers and for brands, and how to apply it in the 38 days left before Black Friday. tgndata is price intelligence software for retailers and brands, and its Assortment Optimization module maps market coverage next to price data, so that is the lens used here.
Assortment optimization is the process of choosing the right products, variants and price tiers for each sales channel, so that your range captures demand and protects margin within the limits of stock, shelf space and supplier terms. It sits between disciplines that are often confused. Assortment planning sets the range for a season. Category management owns the performance of a product group. Assortment optimization is the ongoing decision loop that tests the range against what shoppers want and what competitors carry, then adds, removes, re-tiers or re-prices products accordingly.
For retailers the questions are practical. Which products do competitors list that we do not? Which of our products does everyone else also sell, and which are exclusive to us? How deep is our size, colour and configuration coverage? For brands the questions mirror these. Which retailers list our products, which list a competing brand instead, and where are we out of stock or delisted? tgndata’s Assortment Optimization module is built around those questions. It runs on the same data as the rest of the platform, so range and price are read together instead of in separate spreadsheets. If you want the narrower view of missing products only, tgndata’s guide to assortment gaps covers how competitive data exposes them.
Assortment optimization is also easy to misread as simple pruning. NielsenIQ’s 2021 shelf analysis found that 83% of SKUs in US pet care contribute less than 2% of category sales, and it named baby care, personal care and pet care among the most underperforming categories in Europe’s top five markets. NielsenIQ’s own conclusion was that streamlining is not just about removing SKUs with low sales, and that a more careful, data-driven approach is needed. That distinction, between long-tail clutter and long-tail items that earn their place, is the core of the discipline.
Methodology: NielsenIQ drew on its Intelligent Analytics shelf data and its Global Survey “Unlocking Consumption” (December 2020 to January 2021). The 83% figure refers to US pet care and to physical shelf assortments, and the release does not state a sample size, so treat it as a directional signal for online ranges, not a benchmark.
Takeaway: assortment optimization is not about carrying fewer products, it is about carrying the right ones and knowing which of them the market already prices for you.
Black Friday 2026 arrives as a longer, more cautious and more comparison-driven season across Europe, which moves the decisive range choices into October. The direction is the same from Paris to Athens, even where the numbers differ by country.
Across the region, the mood is muted. Bain’s outlook, published on 15 October 2026, expects growth to come mostly from higher prices rather than more units, and names health and personal care and pure-play e-commerce as the retail segments more likely to grow. Sinch’s 2026 consumer survey found that only 23% of shoppers in its European sample (the UK, France, Germany and Spain) plan to spend more over Black Friday and Cyber Monday. BCG found that nearly 60% of shoppers plan to start researching deals in October or early November and that only about a third have already decided on the exact brand and product, which leaves the range open to influence. Online marketplaces accounted for around 55% of digital purchases in BCG’s survey, up from about 51% in 2024.
Country data shows the same direction with local differences. In Germany, the retail federation HDE forecast €5.8 billion in Black Friday and Cyber Monday turnover for 2025, a 2% decline that would have been the first since it began collecting the data in 2016, and Shopify’s Holiday Retail Report 2026 puts planned German spend at €198 for the weekend. In France, the same Shopify study puts the planned weekend budget at €151, up from €143 in 2025. In Italy, BCG found that 90% of consumers intend to shop year-end sales events, while Denmark (60%) and the Czech Republic (64%) sit lower. In Poland, BCG reports that around 40% of consumer budgets will go on perceived luxury or higher-priced items bought on discount.
The season is also stretching beyond one weekend. NIQ’s Dutch research found that 5% of Dutch consumers had already made a Black Friday purchase by 15 November 2025, and its analysts describe the period as a “Black Month”. In Belgium, NIQ’s retail tracking showed online sales growing 8.2% across the full Black Friday month while traditional retail fell 5.9%, and the core Black Friday week declined slightly in technical consumer goods. In the Netherlands, iDEAL counted 37.8 million payments in the seven days before Black Friday 2025, up from 36.3 million a year earlier, while Black Friday itself reached about 6.3 million transactions, below the 7.1 million record set in 2023.
In Greece, EY’s Future Consumer Index found that 63% of consumers planned to shop the Black Friday and Cyber Monday period in 2025, up from 50% a year earlier. Technology (68%) and clothing and accessories (61%) led intentions, and 81% said they had delayed purchases to wait for the deals.
Put together, demand is being pulled forward and spread across weeks. A range that is only right on the Friday itself is already late. tgndata’s Black Friday pricing prep guide covers the monitoring and pricing tasks for the same window, and assortment decisions are the layer that sits underneath them.
Methodology: Bain’s figures come from its Consumer Lab European Holiday Survey (September 2026, 3,113 respondents in the UK, France and Germany) and its own forecasts. Sinch polled 2,501 consumers in eight countries in July 2026, 902 of them in the UK, France, Germany and Spain. BCG surveyed more than 10,000 consumers aged 18 to 75 in 10 markets (Czech Republic, Denmark, France, Germany, Italy, Poland and the UK, plus the US, Canada and Australia) in September 2025, so its headline averages blend European and non-European answers. HDE’s figure is a forecast built on an IFH Köln survey of more than 1,000 online shoppers in October 2025, not a final result. Shopify’s German figures come from e-commerce magazin (6 October 2026) and its French figures from click2buy’s summary of a July 2026 survey of 2,000 French consumers. NIQ’s Dutch survey covered 12,500 respondents (November 2025), and its Belgian numbers come from weekly sales tracking presented in its technical consumer goods section, so read them as category-specific. iDEAL figures are payment counts reported by NL Times and include all online purchases. EY’s Greek survey was run with MRB and Choose Communications, with no sample size stated in the coverage found. The UK appears where a source covers Europe as a region; it is not an EU market.
Takeaway: the Black Friday window now opens in early November, so range decisions that wait for the week itself are made too late.
Across Europe, Black Friday discounts are often shallower, or less genuine, than they look, which means margin is decided less by headline discounts and more by which products you share with competitors and which you do not. The clearest EU-wide evidence comes from regulators. In a coordinated sweep of Black Friday and Cyber Monday sales, the European Commission and consumer authorities from 23 member states plus Iceland and Norway checked 314 online traders selling goods such as cosmetics, fashion, furniture and electrical items. They found that 30% referenced discounts incorrectly, given that EU rules require a discount to be based on the lowest price of the previous 30 days. Of the 34% of traders that displayed price comparisons, 60% did not clearly explain where the reference prices came from.
Price data from individual markets points the same way. In Germany, the price comparison platform Idealo analysed more than 10,000 products across the 100 most popular Black Friday categories, using offers from about 1,800 online shops. For Black Friday 2024 it found that 73% of products were cheaper than in October, but the average saving was only 7%, and an earlier Idealo review for 2023 found that more than half of the products were cheaper on some other day in November than on Black Friday itself.
Shoppers expect real value. BCG found that a discount of around 30% is the main threshold for what consumers consider a good deal, and that simple percentage-off offers remain the most popular deal type. In Klarna’s Greek survey, 41.2% said they would compare prices before Black Friday to make sure the discounts were genuine, and 25.3% still doubted that discounts were authentic. In Shopify’s German data, 24% of respondents put items in a cart and wait for a price drop.
This is where range becomes a margin question. When a product is listed by many shops and price comparison sites, shoppers can see the market price in seconds and the room to move is small. A product only you carry has no direct comparison, so the price is yours to set. tgndata’s view, stated on its assortment page, is that the products you share with competitors are where margin is lost and the ones only you carry are where it is protected. Knowing which is which is an assortment question first and a pricing question second. The same discipline applies to proof of discounts: tgndata’s guide to the 30-day lowest price rule explains how price history supports compliant promotions in the EU, and the Black Friday margin strategy covers discount bands.
Methodology: The EU sweep was coordinated by the European Commission through the Consumer Protection Cooperation network, and its results were published on 26 March 2026. It measures compliance with discount rules, not discount depth. Idealo compared the average price on Black Friday 2024 with the October average on its own German platform; the 7% figure and the 2023 comparison were reported by the consumer site finanztip citing Idealo. BCG’s figures are averages across its 10 markets, as described above. Klarna surveyed 1,000 Greek consumers aged 18 to 77 with Appinio in November 2025.
Takeaway: when regulators find almost one in three discounts referenced incorrectly and average savings can be as low as 7%, the products only you carry matter more than the discounts you announce on the products everyone carries.
A stockout in peak season sends a meaningful share of shoppers to a competitor, so assortment optimization has to cover availability and not only which products are listed. A listed product that cannot be bought is a gap in practice. Bain’s 2026 European outlook stresses that stock availability and delivery timing carry outsized weight in November and December, and that inaccurate online inventory hurts more then than at any other time of the year. Shopper research shows why. A 2026 survey by Invent.ai of 1,000 UK shoppers found that 54% had noticed poorer on-shelf availability since the Middle East conflict began in February. In fashion, 30% said stockouts made them less loyal to a brand and the same share said they would look for alternatives from a competitor. In grocery, respondents reported that 40% of their planned spend was unavailable or out of stock.
The same logic works in reverse. When a competitor runs out of a product you carry, demand moves, and a range that is monitored against competitor stock can capture it. tgndata’s article on competitor stock availability covers that lever, and its piece on Buy Box stock availability shows how shifts in competitor stock can change Buy Box eligibility even when your own price has not moved.
Methodology: The survey was run by Invent.ai, an inventory optimization vendor, supported by Clariti, with 1,000 UK shoppers in April 2026. It is UK data collected under unusual supply chain conditions and is used here because no comparable 2026 survey for an EU market was found. Bain’s point on availability is a recommendation, not a measured result. Treat it as an indicator of shopper reaction, not as a European benchmark.
Takeaway: in the holiday window a product that is listed but out of stock costs you the sale and, for some shoppers, their loyalty.
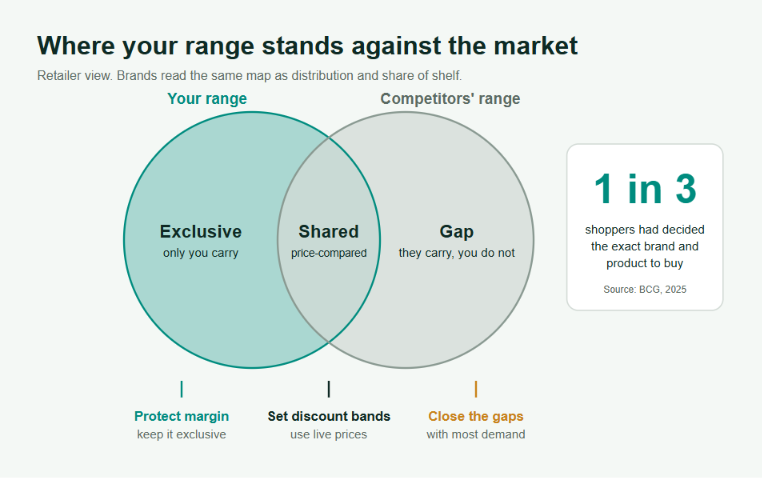
For retailers the main benefits are fewer lost sales from missing products, cleaner price positioning on shared products and better margin on products competitors do not carry. These benefits come from three views of the market that tgndata’s assortment page describes. Category and buying teams spot products and lines that competitors carry and they do not, and they can enter supplier talks knowing the market. Pricing and ecommerce teams see where their range overlaps with competitors, so they know which SKUs are price-compared and which can be priced more freely. Assortment and strategy teams benchmark range depth and width per category and protect the exclusives that set them apart.
The 2026 season gives these benefits a concrete shape, because demand concentrates in specific categories. Across BCG’s 10 markets, clothing (52%), electronics (42%) and beauty (33%) are the top planned spending categories, a pattern BCG describes as largely consistent across countries. Country data sharpens the picture: in Greece, EY found technology at 68% and clothing and accessories at 61% of planned purchases, followed by personal care and beauty at 32% and home and kitchen at 26%. In the Netherlands, NIQ reports that 60% of consumers say they need a new mobile phone but will only buy it during Black Friday. For an electronics retailer, the practical question is whether the mid-price smartphone and accessory range matches that planned purchase before it happens. A thin range in a planned-purchase category means a lost sale that was already decided. This reading is our interpretation of the data, not a finding of the cited surveys.
At scale, you also need to decide which products deserve the closest watch. tgndata’s guide to SKU prioritization for competitive monitoring explains how to rank products by revenue, demand and price sensitivity, which is the practical starting point for a large catalogue.
Methodology: BCG’s category shares are averages across its 10 markets (September 2025). EY’s category shares come from the EY Future Consumer Index Greece 2025 and represent the share of respondents planning to buy each category. NIQ’s phone figure comes from its Dutch Black Friday release (November 2025, 12,500 respondents) and is reported as stated there. Both are stated intentions, not measured sales.
Takeaway: for retailers, assortment optimization turns a long catalogue into three lists, products to match on price, products to protect as exclusives and products still missing.
For brands, assortment optimization means controlling which of your products each retailer lists, how much shelf you hold against competing brands and where your products are out of stock or delisted. tgndata’s assortment page describes this as the other side of the same map. Brand and category managers can report distribution and share of shelf against competing brands without asking every retailer for data. Sales and key account teams can show a retailer exactly which products it is missing while it stocks the competition. Ecommerce and trade marketing teams can see where products are out of stock or delisted and fix it with the retailer before sales are lost.
There is also an internal side. McKinsey’s analysis of a global food manufacturer found that SKU count in one North American business unit had grown 66% in three years, mostly through line extensions, new pack sizes and retailer-specific items, while sales per SKU fell 40% and margins in select categories fell by as much as 10%. After it used analytics to discontinue SKUs whose sales did not cover their added cost, SKU count dropped 25% and gross margin improved by 2 to 4%. McKinsey stresses that blindly cutting the tail can backfire, because a low-volume SKU may play a unique role in the range. Across its experience, it reports that a more nuanced approach can lift net revenue by one to four percentage points and margin by three to six percentage points while trimming SKU count by 25%.
For brands, the peak season adds a distribution check on top. If a retailer is missing your hero product while stocking a rival, or your product is out of stock at a major retailer during Black Week, the cost is a lost sale and a switch to a competing brand. Pricing discipline matters at the same time, and tgndata’s guide to MAP monitoring shows how brands keep retail prices consistent across channels.
Methodology: The McKinsey figures come from “Simpler is (sometimes) better: Managing complexity in consumer goods” (December 15, 2016). They describe North American consumer goods manufacturers, are based on the authors’ client experience and one named case, and are not an independent benchmark. The article is also several years old, so use it for the logic of good and bad complexity, not as a forecast for 2026.
Takeaway: for brands, the question is not only how many SKUs to make, but which retailers list them, at what price and whether they are in stock when the season peaks.
Cross-border marketplaces still shape entry-level price points, but since 1 July 2026 the EU charges a temporary €3 customs duty on low-value parcels, which raises the landed cost of the cheapest imported items. The European Commission said that almost 5.9 billion low-value items were shipped directly from non-EU countries to EU consumers in 2025. The duty replaces the previous exemption for parcels below €150, applies per customs classification in a shipment, and is due to be replaced by category-specific duties from July 2028 when the new EU customs authority starts operating. European retailers broadly welcomed the measure as a step toward fairer competition, and Greece’s retail confederation ESEE had flagged the surge in low-value parcels.
What this means for range is a question to test, not a result to assume. The cheapest items from non-EU platforms now carry an extra cost that weighs most on small single-item orders. Retailers that conceded entry-level price tiers in the past should check whether competing offers from those platforms have changed in price, in range or in delivery promise before they decide to add or drop products at the bottom of a category. Matching lookalike products across marketplaces is the practical hurdle, so build that matching into the market map from step one of the plan below.
Methodology: The duty details come from reporting by Reuters (carried by NST) and Retail Gazette from July 2026, and the 5.9 billion figure is attributed to the European Commission by Retail Gazette. The implications for range are our interpretation and no cited source measures their effect on Black Friday 2026.
Takeaway: the new EU duty changes the cost at the bottom of the price ladder, so check entry-level tiers against competitor offers before the season.
Use the 38 days to Black Friday in six steps: map the market, split overlap from exclusives, lock hero products and availability, set watch rules for early November, review after Singles’ Day and run a daily check from Black Week to Cyber Monday. The dates below assume Black Friday on 27 November and Cyber Monday on 30 November 2026.
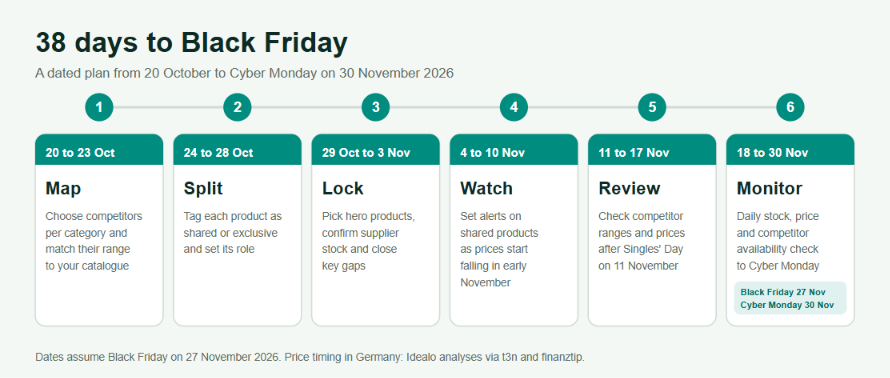
Use the 38 days to Black Friday in six steps: map the market, split overlap from exclusives, lock hero products and availability, set watch rules for early November, review after Singles’ Day and run a daily check from Black Week to Cyber Monday. The dates below assume Black Friday on 27 November and Cyber Monday on 30 November 2026.
Each step depends on reliable matching and fast data. tgndata’s Black Friday pricing prep guide lists the monitoring and pricing tasks that run alongside this plan, and the SKU prioritization guide helps decide where to start when the catalogue is large.
Methodology: The timing of price drops comes from Idealo’s Black Friday analyses as reported by t3n and finanztip, which cover German online prices. The observation about Singles’ Day in 2025 is t3n’s, in its Idealo-based analysis. Dates for Black Friday, Cyber Monday and Singles’ Day were checked against the 2026 calendar.
Takeaway: with 38 days left, the highest-return order of work is map, split, lock, watch, review and then monitor daily.
Each team has one concrete assortment action to complete in the next two weeks.
In addition, BCG found that 48% of consumers across its 10 markets have used or plan to use generative AI around year-end sales, mainly for product comparisons and deal-hunting, and Bain reports that nearly half of Gen Z shoppers in the UK, France and Germany start their holiday search on generative AI platforms. If shoppers start their search with an assistant, accurate range and price data across your channels becomes more important, not less.
Takeaway: the next two weeks are for decisions on range, and November is for monitoring those decisions.
Measure whether your range choices paid off per product, not only per category, so that next year’s plan starts from evidence. For each product, record stock days lost, price position against competitors on shared products and whether exclusives kept their exclusivity. The EU sweep showed how often discounts are referenced incorrectly and Idealo’s German data showed how shallow average savings can be, which makes the post-season margin review more important than the headline sales figure. If you ran price comparisons through the season, you already hold the data to separate products that sold because they were cheap from products that sold because only you carried them.
The post-season review also feeds January planning. tgndata’s guide to a January retail pricing reset covers cleaning holiday pricing data, and the same logic applies to range data.
Methodology: The discount figures are the EU sweep and Idealo’s Black Friday 2024 analysis, as reported earlier in this article. The product-level measures listed are recommendations, not findings from a study.
Takeaway: measure range decisions product by product after the season, so you know which choices to repeat.
Teams should assign each alert type to a clear workflow. An alert has limited value unless the team knows who reviews it, what decision is expected, and when action is needed.
A practical alert workflow could look like this:
For example, a large retailer may route high-priority competitor price drops to the pricing team, MAP issues to brand protection, and stock-related alerts to category management. This prevents every alert from landing on the same person.
Price monitoring alerts work best when every alert has an owner and a decision path.
Assortment optimization is the process of deciding which products, variants and price tiers a retailer or brand offers in each channel so the range captures demand and protects margin. It combines internal sales data with market data on what competitors carry and where products are in or out of stock. The goal is a range that earns its shelf space, not simply a smaller one.
Assortment planning sets the range for a season, SKU rationalization removes products that do not earn their place, and assortment optimization is the continuous loop that tests the range against demand and competitor coverage and then adds, removes, re-tiers or re-prices products. Rationalization is one tool inside optimization. Cutting only the slowest sellers can remove items that play a strategic role in the range.
During Black Friday and the holidays, shoppers across Europe compare prices carefully and wait for deals, so the products you share with competitors are priced by the market while exclusives are priced by you. BCG found that about 77% of consumers in its 10-market study delay purchases to wait for year-end sales, and in Germany Idealo measured an average Black Friday saving of only 7% versus October. The range you carry, and whether it is in stock, therefore decides how much of the available spend you win without deep discounting.
For brands, assortment optimization shows which retailers list their products, which list a competing brand instead, and where products are out of stock or delisted. It also helps control SKU complexity, since a McKinsey case reported that cutting 25% of SKUs lifted a food manufacturer’s gross margin by 2 to 4%. Brands can then fix distribution gaps with retailers before the peak season instead of after it.
Retailers should lock hero products, exclusives and availability checks by the start of November, because nearly 60% of shoppers in BCG’s study start researching deals in October or early November and NIQ found that 5% of Dutch consumers had already bought by 15 November 2025. For Black Friday on 27 November 2026, that leaves about two weeks from 20 October for market mapping and range decisions. After the lock, the work shifts to monitoring rather than changing the range.
tgndata is price intelligence software for retailers and brands, and its Assortment Optimization module maps market coverage so retailers can see what each competitor carries and where their own range overlaps or is exclusive. Brands use the same data to see where their products are sold, out of stock or delisted. Because it runs on the same data as price monitoring, range and price are reviewed in one view.
If you are working on Black Friday and holiday ranges now, tgndata can build a coverage map for one market and the competitors you watch, using your own catalogue. Share the market and the competitors you want to see, and you will get a view of overlaps, exclusives and gaps before the season starts.
Book a demo | Explore Assortment Optimization | Read the Black Friday pricing prep guide
We use cookies to provide you with an optimal experience, for marketing and statistical purposes only with your consent, which you may revoke at any time. Please refer to our Privacy Policy for more information.










Missing an important marketplace?
Send us your request to add it!