
- Product
- Solution for
For Your Industry
- Partners
- Plans & Pricing
- Resources

For Your Industry
A price monitoring ROI calculator estimates your return by adding four benefits (price realization, recovered sales, lower promotion leakage and saved labour) and subtracting the full year-one cost. In the worked example below, a retailer with €20 million of online revenue nets €36,912 in year one, a 132% ROI with a 5.2 month payback. Those figures illustrate the method on stated assumptions. They are not a forecast and not a tgndata client result. This guide gives you the inputs, the formulas, a spreadsheet layout and a sanity check against published benchmarks, so you can replace every assumption with your own numbers.
tgndata is price intelligence software for retailers and brands. The model here is deliberately vendor neutral: it works for any price monitoring platform, and it is built to survive a finance review. If you want the conceptual case first, read Is Price Intelligence Worth It? ROI Explained. This article is the numbers companion to that piece.
It measures the net financial return of automated competitor price monitoring: the margin and time the program adds, minus what it costs to buy, set up and act on. Price monitoring means collecting competitor prices, stock status and promotions for products matched to your own catalog, on a schedule, and turning that data into pricing decisions. The calculator puts a euro value on what changes when those decisions become faster and better informed.
ROI itself is simple: net benefit divided by cost. The difficulty is the benefit side, because price monitoring does not create revenue on its own. It changes the decisions of your pricing team, and each decision type has a different financial signature. A price you can safely raise adds margin immediately. A price you lower in time recovers sales. A discount you shorten saves margin. A report you no longer build by hand saves hours.
That is why the model below separates four levers instead of applying one blended uplift percentage. A single “price monitoring lifts margin by X%” number is easy to write and hard to defend. Four small, named effects with their own inputs are easy to challenge line by line, which is exactly what a CFO or commercial director will do.
The model also reports two views. The full view includes labour savings. The margin-only view excludes them, so you can show a result that does not depend on how finance values the time of your analysts.
Takeaway: model four named levers and report ROI with and without labour savings.
Because a price change flows straight to profit, while a volume change carries the cost of producing and selling the extra units. McKinsey analysed the 1,200 largest public companies worldwide and calculated that a 1% increase in price levels yields an average 8.7% improvement in profit. A 1% cut in variable costs yields 5.9%, and a 1% cut in fixed costs yields 1.8%.
Methodology: the figures come from an analysis of the Global 1200 by McKinsey partners Walter Baker, Michael Marn and Craig Zawada, republished by IndustryWeek. They assume no loss of volume and describe operating profit of large companies, not the gross margin of a mid-size retailer. Treat them as evidence of direction, not as an input to your own model.
The same analysis shows why careless price cuts are expensive. To break even, a 5% price cut has to drive an 18.5% volume increase, which implies a price elasticity of 3.7. McKinsey notes that elasticity is usually around 1.7 to 1.8 and only occasionally reaches 2.5. In plain terms, most price cuts do not pay for themselves.
This is where monitoring earns its return. Without market data, teams cut to be safe. With it, they can see where a gap is real, where a competitor is out of stock, and where a price can hold. Our article on revenue leakage from poor price visibility explains how pricing blind spots erode margin, and how pricing intelligence increases gross margin covers the gains from less leakage and better use of elasticity.
There is also a demand-side reason to monitor. ChannelEngine’s Marketplace Shopping Behavior Report 2026 found that 53% of marketplace shoppers always or often compare the same product across platforms, and that 95% notice price differences between marketplaces. Lower prices were the top purchase factor at 48%.
Methodology: ChannelEngine and Sapio Research surveyed 4,500 online marketplace shoppers in October 2025 across the US, UK, France, Germany and the Netherlands. The published report does not split results by country, so the figures are not purely European.
Takeaway: price decisions are the highest-leverage decisions in the P&L, and shoppers compare, so the quality of your market data directly affects margin.
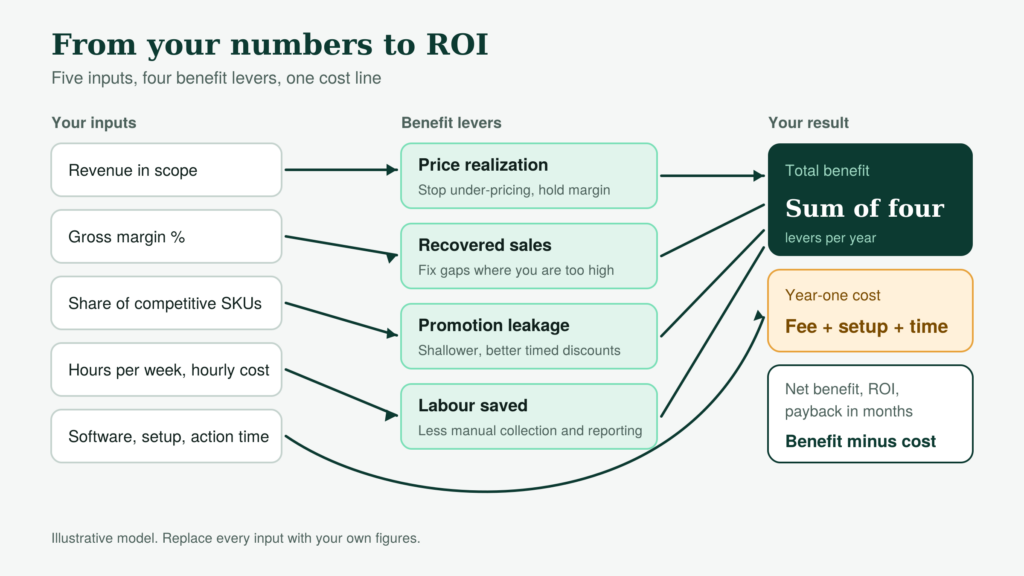
You need ten data inputs and four effect assumptions, and most of the data already sits in your finance system, your catalog or a quick team survey. The table lists each input, where to find it and the value used in the worked example. Replace the example values with your own before you read any result.
| Input | Symbol | Where to find it | Worked example |
|---|---|---|---|
| Annual online revenue in scope | R | Finance or ecommerce reporting | €20,000,000 |
| Gross margin on that revenue | m | Finance | 22% |
| Share of revenue in competitive SKUs | s | SKUs with at least 2 matched competitors | 40% |
| Promotion share of competitive revenue | q | Promo calendar and sales data | 25% |
| Weekly hours on manual collection, cleaning, reporting | H | Short survey of the pricing team | 18 hours |
| Share of those hours removed (assumption) | r | Your estimate, tested in a pilot | 70% |
| Net price uplift on competitive revenue (assumption) | p | Your estimate, tested with a holdout group | 0.3% |
| Volume recovered on competitive revenue (assumption) | v | Your estimate, sized with elasticity data | 0.5% |
| Discount points saved on promotions (assumption) | d | Your estimate, tested in promo reviews | 0.5 points |
| Loaded hourly cost | L | HR or Eurostat benchmark | €38.20 |
| Working weeks per year | W | Calendar | 46 |
| Software fee, onboarding, weekly hours to act | F, O, A | Vendor quote and your own plan | €18,000, €3,000, 4 hours |
Two inputs deserve extra care. The first is the competitive share, s. Price effects only apply to products where you actually compete on price against matched offers. A private label line, a unique bundle or an exclusive range does not belong in that base. Our guide on how to prioritize SKUs for competitive monitoring shows how to rank SKUs by revenue, demand and price sensitivity, and the same ranking gives you a defensible value for s.
The second is the loaded hourly cost, L. A loaded cost includes wages and non-wage costs such as employer social contributions. Eurostat estimated average hourly labour costs in the whole economy at €34.9 in the EU and €38.2 in the euro area in 2025, with national figures ranging from €12.0 to €56.8. The worked example uses the euro area figure of €38.20.
Methodology: Eurostat’s estimates cover the whole economy and all job types. A pricing analyst in Germany, Benelux or Greece will usually sit far from the average in one direction or the other, so use your own HR figure if you have it.
Diagram showing five inputs feeding four benefit levers that combine into total benefit, compared with year-one cost to give net benefit, ROI and payback
Takeaway: collect ten data inputs, set four effect assumptions, scope price effects to competitive SKUs, and use a loaded hourly cost rather than salary.
Each lever has its own formula, and each one multiplies a base you can verify by an effect you can test. Let Rc be competitive revenue, which is R multiplied by s. In the worked example, Rc is €8,000,000.
1. Price realization. Gain = Rc × p, where p is the net average price uplift on competitive revenue. It captures the margin from holding or raising prices where monitoring shows the gap is unjustified, net of any cuts you had to make. A p of 0.3% means the average realized price on competitive revenue rises by three thousandths. In the example that is €24,000.
2. Recovered sales. Gain = Rc × v × m, where v is the volume you recover by fixing products priced above market, and m is gross margin. Revenue is not profit, so the formula multiplies by margin. A v of 0.5% at a 22% margin gives €8,800. Our article on delayed price updates covers how slow reaction costs sales, which is where this lever comes from.
3. Promotion leakage avoided. Gain = Rc × q × d, where q is the promotional share of competitive revenue and d is the discount depth you no longer give away, in percentage points. With 25% promotional share and 0.5 points saved, the gain is €10,000. This lever comes from matching competitor promotions only when they are real and only as deeply as needed.
4. Labour saved. Gain = H × r × W × L. Eighteen weekly hours, a 70% reduction, 46 weeks and €38.20 per hour give 579.6 hours and €22,141.
Total benefit B is the sum of the four. The cost side is C = F + O + (A × W × L), which adds software, one-off onboarding and the time your team spends acting on the data. Then:
Levers 1 and 2 can pull against each other. A price cut that recovers volume lowers price realization on that product. Enter p as a net figure, after your expected cuts, and do not count the same product’s gain twice.
Takeaway: multiply a verifiable base by a testable effect for each lever, and enter price uplift net of cuts.
Count all of it: the subscription, onboarding and integration, and the hours your team spends acting on the data. Most weak business cases list only the subscription. A finance reviewer will add the rest, so it is better to show it yourself.
In the worked example the software fee is €18,000 a year and onboarding is €3,000. Both are placeholders for your vendor’s quote. The third item is time to act: four hours a week for 46 weeks at €38.20, or €7,029. Monitoring produces signals, and someone has to review alerts, approve changes and handle exceptions. Year-one cost comes to €28,029.
Data quality sits behind every cost and benefit figure. If product matching is wrong, a price gap is a false signal and a repricing rule can cut a price that should have held. Our pricing data quality guide explains how to measure accuracy, matching and freshness, and how product matching works explains how EAN, SKU, title and AI matching work and why matching decides whether competitor prices can be trusted. Ask any vendor for measured accuracy and update frequency before you accept their benefit claims. The question of how often to monitor competitor prices also changes both cost and benefit, because faster refresh is only valuable on SKUs where prices move.
Takeaway: include onboarding and action time in cost, and treat data quality as a precondition for any benefit.
A retailer with €20 million of online revenue, 40% of it in competitive SKUs, earns €64,941 of annual benefit against €28,029 of year-one cost, a net gain of €36,912. The company is hypothetical. It is not a tgndata customer, and every figure is an assumption you should replace.
| Line | Calculation | Result |
|---|---|---|
| Competitive revenue (Rc) | €20,000,000 × 40% | €8,000,000 |
| 1. Price realization | €8,000,000 × 0.3% | €24,000 |
| 2. Recovered sales | €8,000,000 × 0.5% × 22% | €8,800 |
| 3. Promotion leakage avoided | €8,000,000 × 25% × 0.5 points | €10,000 |
| 4. Labour saved | 18 h × 70% × 46 weeks × €38.20 | €22,141 |
| Total benefit (B) | Sum of lines 1 to 4 | €64,941 |
| Software and onboarding | €18,000 + €3,000 | €21,000 |
| Time to act | 4 h × 46 weeks × €38.20 | €7,029 |
| Year-one cost (C) | €28,029 | |
| Net benefit | B minus C | €36,912 |
| ROI | €36,912 / €28,029 | 132% |
| Payback | €28,029 / (€64,941 / 12) | 5.2 months |
Four reading notes help you judge this result. First, the margin-only view, which drops labour savings, gives a benefit of €42,800 and an ROI of 53%, with a payback of 7.9 months. Second, labour savings alone cover 79% of year-one cost, so most of the downside risk sits in the margin lines. Third, break-even is low: once labour savings are counted, the margin lines only need to deliver €5,888, which is 0.07% of competitive revenue. Without labour, break-even is 0.35% of competitive revenue. Fourth, the margin gain of €42,800 equals about 1% of the retailer’s €4.4 million gross profit, a modest claim.
Takeaway: report the full ROI and the margin-only ROI, and state the break-even gain, which is usually far smaller than the base case.
Stock availability changes can explain competitor pricing behavior. A competitor price may look aggressive until the team sees that the product is out of stock, low in stock, or only available through third-party sellers.
Availability alerts are useful when they show:
For example, a marketplace seller may see a competitor’s listed price remain low, but the item is out of stock. Matching that price would be unnecessary and could damage margin.
Price without availability context can lead to bad pricing decisions.
Published results vary widely, so use them to sanity-check your assumptions rather than to copy them. Three sources help, each with different strengths and limits.
McKinsey’s 2014 article on big data and pricing profiled companies with very large numbers of SKUs and transactions that set prices at a more granular product level. They saw a profit margin lift of 3 to 8 percent. The same article estimates that up to 30 percent of the thousands of pricing decisions companies make every year fail to deliver the best price.
Methodology: the margin lift figures describe the companies McKinsey profiled and refer to granular pricing in general, not to price monitoring software specifically. The 30 percent figure is a McKinsey estimate.
tgndata’s published case study on Sportisimo, a sporting goods retailer in Central Europe, reports 60 or more hours saved per week through automated competitor monitoring, a 40% gain in pricing analysis efficiency, and pricing and reporting workflows that run three times faster. Our own Sportisimo case study gives the full context.
Methodology: the figures are published by tgndata on its own site for one retailer, and the case study does not state the baseline or measurement period. Treat them as one customer’s reported result, not a guarantee. Sportisimo monitors thousands of competitor prices daily, so its hours saved are larger than in the example.
A vendor-published example from Grepsr, a web data provider, describes an anonymous global consumer electronics retailer with more than 100,000 SKUs that reported a 5 to 7% revenue lift on competitive SKUs and a 20% reduction in manual monitoring effort.
Methodology: this is a vendor-reported, anonymous result from a different company, and it measures revenue lift, not margin. It is cited neutrally and without endorsement, and it cannot be verified from the source.
Compare these against the base case. The example’s margin gain of €42,800 is about 0.2% of total online revenue and about 1% of gross profit, well below the 3 to 8 percent range McKinsey reports for granular pricing. The labour assumption of 12.6 hours saved per week is about a fifth of the Sportisimo figure. The base case is therefore conservative relative to published results, which is the right place to start a business case.
Takeaway: published gains are much larger than the base case, so a modest model leaves room to be proven right.
You can build it in about 15 minutes with 14 input cells and 12 formula cells. Put inputs in column B and use decimals for percentages (0.22 for 22%). The layout below works in Excel and Google Sheets.
INPUTS
B2   Annual online revenue in scope (R)            20000000
B3   Gross margin (m)                              0.22
B4   Share of revenue in competitive SKUs (s)      0.40
B5   Promotion share of competitive revenue (q)    0.25
B6   Net price uplift (p)                          0.003
B7   Volume recovered (v)                          0.005
B8   Discount points saved (d)                     0.005
B9   Manual hours per week (H)                     18
B10  Share of hours removed (r)                    0.70
B11  Loaded hourly cost (L)                        38.20
B12  Working weeks (W)                             46
B13  Software fee per year (F)                     18000
B14  Onboarding, one-off (O)                       3000
B15  Hours per week to act (A)                     4

FORMULAS
B17  Competitive revenue          =B2*B4
B18  Price realization            =B17*B6
B19  Recovered sales margin       =B17*B7*B3
B20  Promotion leakage avoided    =B17*B5*B8
B21  Labour saved                 =B9*B10*B12*B11
B22  Total benefit                =SUM(B18:B21)
B23  Year-one cost                =B13+B14+B15*B12*B11
B24  Net benefit                  =B22-B23
B25  ROI                          =B24/B23
B26  Payback (months)             =B23/(B22/12)
B27  Margin-only ROI              =(SUM(B18:B20)-B23)/B23
B28  Break-even gain, % of Rc     =(B23-B21)/B17
Add a second column for each scenario so the conservative, base and optimistic cases sit side by side. Keep the inputs you are least sure about, p, v and r, in a different color so reviewers know where to push. Our article on how to measure price elasticity using competitive data helps you size v, and dynamic pricing software versus manual repricing compares what automation gains against manual repricing.
Takeaway: keep inputs and formulas on one sheet, add scenario columns, and highlight the three assumptions with the most uncertainty.
Enter your own numbers. Everything updates as you type. Values start at the worked example in this article.
Break-even gain is the combined price, sales and promotion gain needed, as a share of competitive revenue, once labour savings are counted. Results are estimates based on your inputs, not a guarantee.
Validate these numbers in a demoThey fall apart in five predictable places: revenue counted as profit, double counting, missing action time, an unscoped catalog and no control group. Each one is easy to avoid once you know it.
The control group is the strongest part of any business case. It turns assumptions into a measured effect and gives finance a result that does not rest on vendor claims.
Takeaway: scope to competitive SKUs, net your price effects, budget action time and prove the effect with a holdout group.
It means you can bring a finance-ready business case in one working session, built on your own numbers and a downside you have already tested. For pricing managers and commercial directors, the concrete steps are these.
For brand managers, the same model applies to MAP and MSRP monitoring. Replace price realization with the margin protected on SKUs where unauthorized discounting is removed, and replace recovered sales with sales retained at authorized retailers. For marketplace managers, replace the volume lever with Buy Box share on matched ASINs.
Takeaway: fix scope, measure the manual baseline, get a real quote, test three scenarios and pilot with a holdout group.
A price monitoring ROI calculator is a model that turns your own revenue, margin, hours and cost figures into a net benefit, an ROI percentage and a payback period for competitor price monitoring. It adds four benefit lines (price realization, recovered sales, promotion leakage avoided and labour saved) and subtracts the full year-one cost. Using your own inputs matters because the result depends on your catalog, your competition and your team.
ROI equals total annual benefit minus total year-one cost, divided by total year-one cost. Benefit is the sum of margin gains and labour savings, and cost includes the subscription, onboarding and the hours your team spends acting on the data. In the worked example, €64,941 of benefit against €28,029 of cost gives a 132% ROI.
Payback in months equals year-one cost divided by monthly benefit. The worked example pays back in 5.2 months in the base case, 10.7 months in the conservative case and 3.0 months in the optimistic case. Your own payback depends mainly on the revenue in scope and the manual hours you remove.
Yes, but show a margin-only view next to it. In the worked example, labour savings cover 79% of year-one cost, while margin gains alone still return 53%. Showing both lets a finance reviewer see the result with and without the softer line.
There is no universal figure, so start conservative and validate. McKinsey reported a 3 to 8 percent profit margin lift for companies that moved to more granular pricing, while the base case here assumes a gain equal to about 1% of gross profit. A holdout test on matched SKUs shows what your catalog can deliver.
The ROI holds only if competitor products are matched correctly and prices are fresh enough to act on. A wrong match turns a price gap into a false signal and can trigger a bad price change that costs margin. Check matching accuracy and update frequency before you trust any benefit estimate.
We use cookies to provide you with an optimal experience, for marketing and statistical purposes only with your consent, which you may revoke at any time. Please refer to our Privacy Policy for more information.










Missing an important marketplace?
Send us your request to add it!