
- Product
- Solution for
For Your Industry
- Partners
- Plans & Pricing
- Resources

For Your Industry
The price monitoring alerts that matter most are alerts tied to pricing action. Ecommerce teams should prioritize alerts for competitor price drops and increases, stock availability changes, promotions, MAP violations, and margin-risk thresholds.
A good alert should answer one question: does this market change require a pricing, commercial, or brand protection decision? If the answer is no, the alert is probably noise.
Pricing data quality is the degree to which competitor price data is accurate, correctly matched, fresh, and complete enough to support a pricing decision without manual re-checking. It is not a single number. It is a set of measurable properties that all have to hold at the same time, and a failure in any one of them can turn a correct-looking dashboard into a misleading one.
Consider a cosmetics retailer monitoring 5,000 SKUs across eight competitors. The feed may report 98% coverage and timestamps from this morning, yet if a tenth of the matched listings are a different pack size, the team will see competitors as cheaper than they really are on those items. Every dimension looked healthy in isolation, and the decision was still wrong.
This guide organizes pricing data quality into three pillars and two safeguards:
If you want the diagnostic view of what goes wrong and why, our article on how bad data creates bad pricing decisions covers causes and warning signs. This guide is the measurement and governance companion: how to score each pillar, what thresholds to start with, and how to audit a vendor or an in-house pipeline.
Pricing data quality is the standard every price must clear before a decision is built on it, and each pillar needs its own metric.
Pricing data quality matters because every pricing decision, manual or automated, inherits the quality of the data beneath it, and most organizations never measure that quality. The evidence from outside retail is consistent, and the evidence from European retail shows that price errors are common even where the law demands precision.
Start with the cost of poor data in general. Gartner’s widely cited estimate is an average of US$12.9 million per year per organization. The methodology matters: the figure comes from Gartner’s 2020 survey of reference customers of data quality software vendors, which a 2026 review by Reliable describes as 154 organizations associated with 16 vendors, with each respondent estimating its own cost. It is cross-industry, US-dollar based and not specific to retail pricing or to Europe, so treat it as directional rather than as a benchmark for your business. The more useful finding on the same Gartner page is that 59% of organizations do not measure data quality at all.
Now the European picture. On 26 March 2026 the European Commission and consumer authorities from 23 Member States, plus Iceland and Norway, published the results of a sweep of online discounts during Black Friday and Cyber Monday. Authorities checked 314 online traders selling goods such as cosmetics, fashion, furniture and electrical goods, and found that 30% referenced discounts incorrectly. In addition, 34% of traders displayed price comparisons, and 60% of those did not clearly explain where the reference prices came from. Some outlets report different trader counts for the sweep; we use the 314 figure from the Commission and Ireland’s CCPC.
One distinction is important. The Price Indication Directive requires a discount to be based on the lowest price the trader itself applied in the previous 30 days, so the sweep tested traders’ own price records, not competitor data. The lesson for pricing teams is still direct: when 3 in 10 sampled traders get a price reference wrong, price data errors are common, they are measurable at scale, and regulators now sample for them. Our guide to the 30-day lowest price rule shows how clean price history protects you on the compliance side.
Finally, the market you are pricing into is overwhelmingly online. Eurostat reports that in 2025, 78% of EU internet users aged 16 to 74 had bought or ordered goods or services online in the previous 12 months, up from 62% in 2015. Shoppers compare easily, so a price position built on wrong data is exposed quickly. Our piece on revenue forecasting accuracy shows how the same errors spread into finance.
You cannot manage what you do not measure, and most teams are not yet measuring their pricing data.
Price accuracy is the share of collected prices that equal the price a shopper would actually pay on the competitor page at collection time, measured on the same basis as your own price. “Same basis” is where most hidden errors live. A price can be correctly read from a page and still be wrong for your purpose.
Common basis mismatches include the price after a coupon versus the list price, a marketplace price excluding shipping versus a total price, and logged-in B2B pricing versus public pricing. ProWebScraper lists these among the ways competitor pricing data goes wrong. In Europe, VAT adds a further trap. Standard VAT rates in January 2026 were 19% in Germany, 21% in the Netherlands and Belgium, 17% in Luxembourg and 24% in Greece, according to the Tax Foundation. A net price compared with a gross price in Germany is a 19% error before any competitor has moved, and the same mistake in Greece is 24%.
How to measure it. Define a price as correct when it matches the live page to the cent and uses the same price type as your own. Then calculate:
Sample size. Use the standard formula for a proportion, n = z squared x p(1 minus p) divided by e squared. At 95% confidence (z = 1.96) with the conservative assumption p = 0.5, a margin of error of 5 percentage points needs about 385 checks, and 3 points needs about 1,067. This is textbook statistics and assumes random sampling from a large population, so it is a planning guide, not a guarantee. If you want to detect a rare failure, such as a single competitor template breaking, you will need a larger sample for that stratum.
What breaks accuracy. Competitor site redesigns can make an extraction rule read the wrong field, such as a shipping fee in place of the item price. Cached or blocked pages can serve an old price. Currency and VAT handling can differ between markets. Promotional prices can replace list prices without a label. Each of these is detectable with the sampling method above and with automated checks described later.
Accuracy is not whether the price was read, it is whether the price is comparable, and only a sampled check against the live page can prove it.
Measure matching with two numbers together: coverage, the share of your catalog linked to at least one competitor listing, and precision, the share of those links that are the identical product. A coverage number alone can be inflated by accepting looser matches, which silently destroys precision. For a full explanation of how identifier, attribute and AI methods work, see our guide to how product matching works in price monitoring.
The two numbers combine into effective coverage. Take an illustrative 10,000 SKU catalog with 92% coverage and 96% precision. That is 9,200 linked SKUs, of which 8,832 are correct and 368 are wrong links, so effective coverage is 88.3%. Those 368 wrong links are not noise. Each one can generate a false undercut alert or trigger a repricing rule on a product that was never comparable.
Match coverage versus match precision, illustrative 10,000 SKU catalog Illustrative example, not tgndata data.
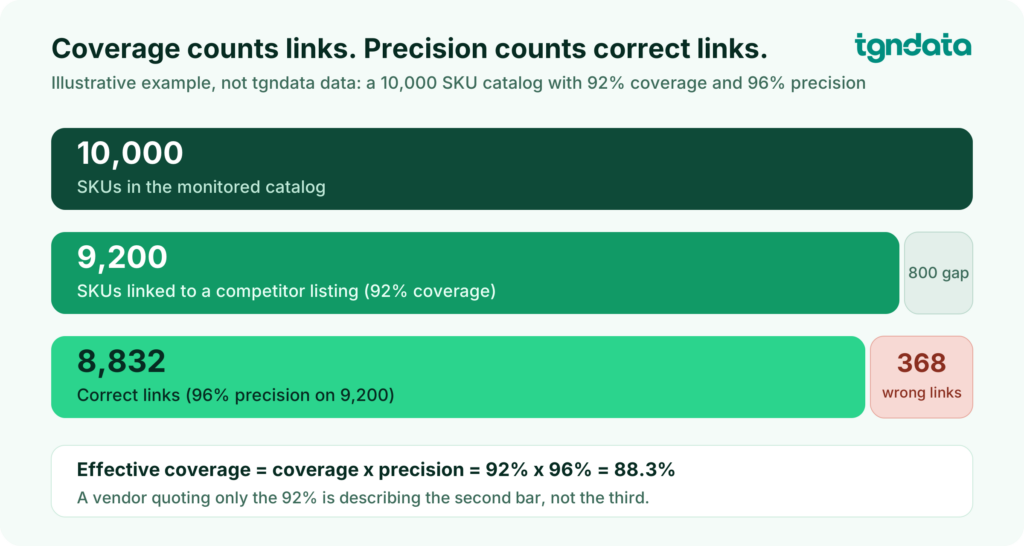
Why matching is hard to get right. Independent research shows the difficulty. The WDC Products benchmark from the University of Mannheim’s Data and Web Science Group (Peeters, Der and Bizer, published at EDBT 2024) is built from product data extracted in 2020 from 3,259 e-shops, covering 11,715 product offers that describe 2,162 distinct products. The authors report that leading matching systems reached top F1 scores between 0.64 and 0.89 depending on the benchmark variant, and that all systems performed worse on products they had not seen during training. Methodology and caveat: F1 combines precision and recall for pairwise matching, and the benchmark deliberately includes hard look-alike cases, so a production system that uses identifiers and validation will not score the same. The takeaway holds: matching based on titles or AI alone degrades on new and look-alike products, which are exactly the products a growing catalog keeps adding.
The failure patterns to audit for. Variants (128GB matched to 256GB), multipacks (a 2-pack matched to a single unit), bundles (a laptop with a bag priced as if it were the laptop alone), last year’s model with a near-identical name, and marketplace sellers listing a product under the wrong EAN. Identifiers such as EAN and GTIN are the strongest signal when present and correct, but coverage and cleanliness vary, and private label products have no external identifier at all.
How to audit matching.
What vendors claim. Wiser publishes match accuracy of 98% or higher. SunTec India announced a price monitoring platform on 21 July 2026 that it says delivers 99% or higher matching accuracy using AI models, EAN and GTIN identifiers and human review. tgndata publishes a 99% or higher product matching figure on its own site. All three are self-reported with their own definitions, so run the audit above on any of them, including ours.
A coverage figure without a precision figure is half a measurement, and a precision figure you cannot audit is a claim.
Pricing data needs to be fresh enough that the age of a price at the moment of decision is shorter than the typical interval between competitor price changes in that category. That interval differs widely, so a single refresh rate for the whole catalog is almost always wrong in both directions: too slow where prices move, wasteful where they do not.
Evidence on volatility comes from Decodo, a web data collection vendor, whose 2025 study tracked 12 products on each of more than 120 retailers in 40 countries, capturing prices every four hours and recording over 1.5 million observations. Fashion showed the highest price volatility, and electronics came second with 351,280 recorded price changes, of which 51.5% were decreases and 48.5% increases. Caveats: the sample is small per site, it is global rather than European, and Decodo sells collection tools. Read it as a direction, not a European benchmark. The direction is clear, though: in electronics and fashion, a price that is a day old may already describe a market that no longer exists.
Measure price age, not refresh frequency. A schedule that says “daily” tells you nothing about what actually arrived. Track these metrics per SKU tier:
Tier your SKUs. Our suggested starting limits, shown below, are tgndata guidance and not an industry benchmark: under 6 hours for top revenue, Buy Box and promotional SKUs; under 24 hours for the core assortment; under 72 hours for the long tail. Tighten them in volatile categories and during Black Friday and other promotion periods. Our guides on how often to monitor competitor prices and how to prioritize SKUs for competitive monitoring explain how to assign tiers.
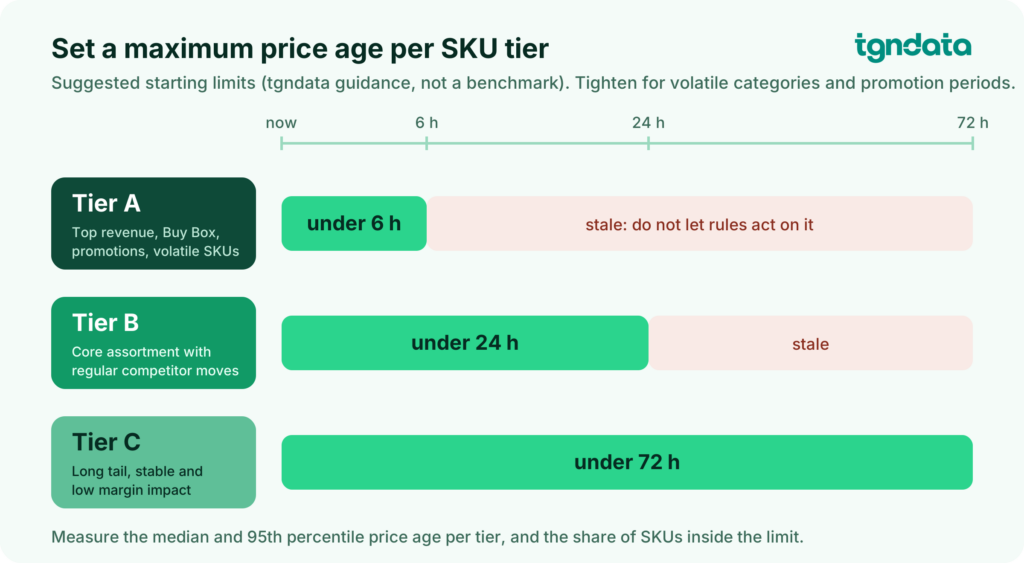
Freshness tiers: suggested maximum price age by SKU tier Suggested starting limits, tgndata guidance, not a benchmark.
Even manual processes need a limit. Priceva’s checklist for choosing a price monitoring service advises checking monitored data no later than 24 hours after the previous check, because repricing or a promotion can change a price in between. The cost of missing that window is covered in our article on delayed price updates and their revenue impact.
Freshness is a per-tier limit on price age, and the only honest freshness metric is the share of SKUs actually inside that limit.
Every price record should carry stock state, shipping cost, promotion status and seller identity, because a headline price without them can point the pricing team in the wrong direction. A price is never one number. It is a price, at a time, from a seller, for an item that may or may not be available.
Retail Focus, a UK trade publication, makes the stock point sharply: an out-of-stock listing at £199 is not a competitive price, it is a stale one. The same logic applies in Europe. A competitor that is out of stock is not a threat on that SKU today, and treating its price as a live undercut can cut your margin for no commercial gain. Our article on Buy Box and competitor stock availability shows how availability shifts marketplace eligibility without any price change.
Required fields worth enforcing as a completeness rule:
PromptCloud, a data services provider, recommends tracking freshness, completeness, duplication rates and distribution drift in competitor price feeds before they corrupt automated pricing decisions. Completeness is the metric most often skipped, and it is cheap to measure: the share of records that contain every required field. For deeper coverage of these signals, see beyond price monitoring for competitive insight.
A price without its context is a number, and a number without context is how a pricing rule ends up chasing an offer nobody can buy.
Validate in layers: automated checks before data is published, human review for low-confidence cases, and scheduled audits against live competitor pages. No single layer catches everything. Automation catches volume, humans catch the edge cases, and audits catch what both missed.
PromptCloud warns that silent data corruption is the biggest risk in automated pricing systems, because nothing visibly breaks. That is why the checks must run before the data reaches a rule. A practical stack:
Wiser describes a similar layered approach, combining daily accuracy checks, weekly sampling and continuous user acceptance testing. The principle matters more than the vendor: quality is a process with owners and cadences, not a setting.
Add a circuit breaker. Automated repricing should act only on records that pass freshness, match confidence and stock checks. If a record fails, the rule should hold, not guess. Our guide to dynamic pricing guardrails and MAP compliance shows how to put these limits around automation.
Validation is not about catching every error, it is about making sure no single bad number can reach a pricing decision unchecked.
A pricing data quality scorecard should track eight metrics covering accuracy, matching, freshness, completeness and responsiveness, each with a defined measurement method and a threshold. The thresholds below are starting points from tgndata guidance, to calibrate by category and risk appetite. They are not industry benchmarks.
| Metric | Definition | How to measure | Suggested starting threshold |
|---|---|---|---|
| Price accuracy rate | Correct prices divided by prices checked | Monthly stratified sample of 385 or more, compared to live pages | 98% or higher |
| Match precision, overall | Correct links divided by links audited | Quarterly stratified sample of 385 or more links | 97% or higher |
| Match precision, top SKUs | Correct links on top 200 revenue SKUs | Audit every link on the top 200 | 99% or higher |
| Match coverage | Linked SKUs divided by monitorable catalog | By competitor and category | Set per category, track the trend |
| Freshness inside tier | Share of SKUs younger than the tier age limit | Price age reported per tier | 95% or higher |
| Context completeness | Records with stock, shipping, promotion and seller fields | Automated field check | 95% or higher |
| False alert rate | Alerts that fail a manual check divided by alerts reviewed | Weekly review of a sample of alerts | Below 5% |
| Time to correct | Hours from a reported error to the fix | Log every reported error | Top SKUs within one business day |
Use the scorecard to place yourself on a simple maturity ladder:
A team that has never audited its data is at level 1 by definition, and the 30-day audit below is a practical route to level 3, the step that changes how much leadership trusts the numbers. For a deeper look at auditing and scaling accuracy, see pricing data accuracy.
What gets a threshold gets managed, and what has no owner quietly drifts.
Audit a vendor in four weeks: set the sample, verify against live pages, stress test with known problem cases, and score the results against the scorecard. The method works for an in-house pipeline as well.
Illustrative scenario: a retailer with a 20,000 SKU catalog audits 385 links and finds 11 wrong, a precision of 97.1%, just above the 97% starting threshold. Then it audits its top 200 SKUs and finds 5 wrong, a precision of 97.5%, well short of 99%. The overall number looked acceptable, but the revenue-weighted view exposed the problem, and the team asked for those 200 links to be re-verified first. This is a hypothetical example to show the method, not tgndata data.
For a longer checklist of questions to put to a supplier, see Is your pricing data vendor delivering true value? and, if you are weighing a build-it-yourself approach, our comparison of pricing intelligence versus web scraping tools.
An audit turns a vendor’s claim into your own measurement, and four weeks is enough to know which one you have.
This guide translates into three concrete jobs, one for each of the roles that depend on competitor price data. Each can start this week.
Pricing Managers
Ecommerce and Marketplace Managers
Commercial Directors and Revenue Managers
The teams that win with price data are not the ones with the most data, they are the ones who can prove which numbers to trust.
tgndata is price intelligence software for retailers and brands, and its approach to data quality rests on traceability, layered matching and human validation. Every competitor price in the platform is traceable to the exact source URL it was collected from, so pricing teams can verify any number rather than take it on faith. Product matching combines unique identifiers, structured attributes and AI models, and low-confidence matches go to human validation before they reach a pricing decision. Market activity data helps teams focus first on the changes with real commercial impact, as covered in our guide to how pricing teams prioritize actions fast.
tgndata publishes a product matching accuracy figure of 99% or higher on its site. Use the audit in this guide to verify that figure on your own catalog, as you would for any vendor. For examples of how retailers use tgndata for monitoring at scale, read the Biker-Boarder case study, which describes monitoring 23,881 products across 50 competitors with daily pricing intelligence, and the XXXLutz case study on competitive pricing and stock visibility.
Quality you can audit is worth more than quality you are asked to believe.
Pricing data quality is the degree to which competitor price data is accurate, correctly matched to your products, fresh enough for the decision at hand, and complete with context such as stock and shipping. It is measured with several metrics together, not one score. Data that passes all of them can drive a pricing decision without manual re-checking.
Take a random sample of collected prices, compare each one to the live competitor page on the same basis (VAT, currency, shipping, promotion), and calculate the share that match. A sample of about 385 prices gives a margin of error near 5 percentage points at 95% confidence, and about 1,067 gives roughly 3 points. Stratify the sample by competitor and category, because errors cluster by site.
Match precision is the share of created product links that point to the identical item. As a starting point, aim for 97% or higher across the catalog and 99% or higher on your top revenue SKUs, then calibrate by category. Vendors publish figures such as 98% or 99%, but each defines accuracy differently, so verify any claim with your own audit.
Fresh enough that the age of a price at the moment of decision is shorter than the typical gap between competitor price changes in that category. A practical start is to tier SKUs: under 6 hours for top revenue and volatile items, under 24 hours for the core assortment, and under 72 hours for the long tail. Fashion and electronics tend to need the tightest limits.
Run automated checks continuously, a small manual spot check weekly, and a full stratified audit of prices and matches each quarter. Re-audit immediately after a vendor change, a competitor site redesign, or a large catalog update, because those events are when silent errors appear. Record every audit result so you can see the trend, not just the snapshot.
Coverage is the share of your catalog linked to at least one competitor listing, while precision is the share of those links that are the identical product. Coverage can be inflated by accepting looser matches, which lowers precision. Multiply the two to get effective coverage, the share of your catalog with a correct competitor link.
Want to know how your pricing data measures up on accuracy, matching and freshness? Book a demo and we will walk through the scorecard with your own catalog and competitors.
Keep reading: How Product Matching Works in Price Monitoring | Pricing Data Accuracy: How Accurate Is Your Pricing Data? | How Often Should You Monitor Competitor Prices
We use cookies to provide you with an optimal experience, for marketing and statistical purposes only with your consent, which you may revoke at any time. Please refer to our Privacy Policy for more information.










Missing an important marketplace?
Send us your request to add it!